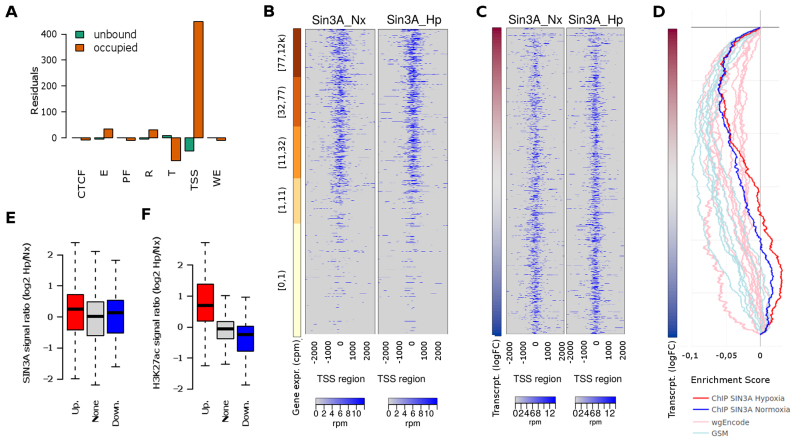
Figure 4.
Genome-wide SIN3A binding profile. Exponentially growing non-synchronized HUVEC were exposed to 1% oxygen for 16 h and then processed to determine SIN3A binding profile by ChIP-Seq. (A) The distribution of the normoxic SIN3A binding regions across the functional regions of the HUVEC genome was studied and compared to that expected by chance using a chi-squared goodness of fit test (Chi-square6 = 213 740, P < 10−15). The graph represents the Pearson residuals resulting from the test. The functional regions (chromatin states as defined by the ENCODE consortium) are: ‘TSS’, predicted promoter region including TSS; ‘PF’, Predicted promoter flanking region; ‘E’, Predicted enhancer; ‘WE’, Predicted weak enhancer or open chromatin cis regulatory element; ‘CTCF’, CTCF enriched element; ‘T’, Predicted transcribed region; ‘R’, Predicted Repressed or Low Activity region. (B and C) Heatmaps showing the enrichment of SIN3A in a 4 Kb region centered in the TSS. Each row represent a gene and rows are sorted according to gene expression level as determined from RNA-seq (B) or log fold change in transcription (Newly transcribed fraction) induced by hypoxia (C). In the latter case, only genes with detectable expression (cpm > 1 in at least two samples) are represented. (D) GSEA graph the distribution of the normoxic SIN3A (blue) and hypoxic (red) SIN3A binding sites from this study (ChIP SIN3A) and those determined by the ENCODE project (‘wgEncode’, ligth red) and individual research groups (‘GSM’, light blue) across genes expressed in HUVEC sorted according to their transcriptional response to hypoxia as in C. The information about each SIN3A data set together with ES and P-values for echrichment is shown in Supplementary Table S4. (E) The log-ratio of the normalized SIN3A signal in hypoxia over normoxia was computed for all promoters. The boxplot represent the distribution of values obtained for genes upregulated (‘Up.’, logFC > 1 and adjusted P-values < 0.001), downregulated (‘Down.’, logFC < −1 and adjusted P-values < 0.001) and not effected by hypoxia (‘None’). The differences between groups were not statistically significant for α = 0.01 (ANOVA F29 053 = 3.707, P = 0.0246). (F) Wig files from reference (56) were downloaded from the NCBI GEO repository (GSE50144). The log-ratio of the normalized H3K27ac signal in hypoxia over normoxia was computed for all promoters and represented as in (E). The differences between mean signals in each group were statistically significant (ANOVA F29 053 = 247.9, P < 2e-16) and the signal in both up- and downregulated groups was significantly different to that in control genes (post-hoc Tukey HDS, adjusted P-value < 2e-16).

