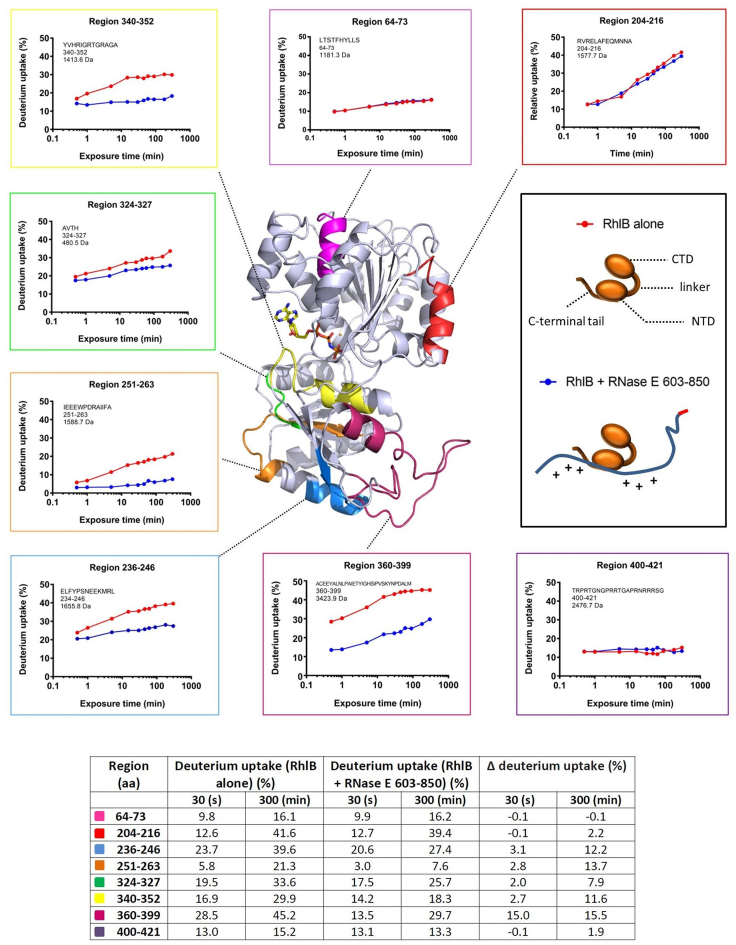
Figure 4.
Impact of RNase E binding on RhlB exposed surfaces. The RNase E binding sites in RhlB are mapped from hydrogen-deuterium exchange analyses (HDX-MS). In the central panel is a homology model of RhlB colored in gray, with the exception of five sites in the C-terminal RecA-like domain of the helicase which have a reduced deuterium uptake when RNase E (603–850) is bound, in addition to two randomly selected sites in the N-terminal domain which do not have a different exposure to the solvent upon RNase E 603–850 binding. The C-terminal tail (region 400–421) is highly flexible and therefore not generated as part of the homology model. Non-hydrolyzable adenosinetriphosphate (ATP) shown in stick form is positioned in the catalytic site. The panels along the top, left and bottom show the hydrogen/deuterium exchange rates of selected regions in RhlB in the presence and absence of RNase E 603–850 (blue and red, respectively). The panel on the right is the cartoon schematic for the helicase domains and for the interaction mode between the helicase C-terminal RecA-like domain and RNase E. The homology model was generated with the Phyre2 program (67) using as a template the crystal structure of the RNA helicase VASA from Drosophila (51). The table (inset) provides a quantitative summary of the HDX-MS results.

