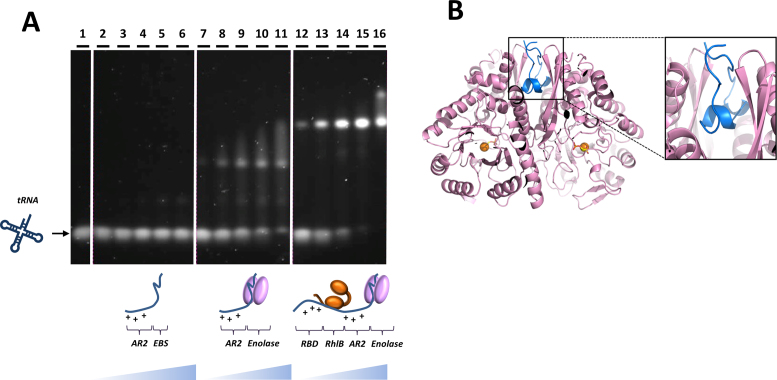
Figure 5.
Recognition of RNase E and enolase, and its impact on the RNA binding capabilities of AR2. (A) Native agarose gel shift assay stained for RNA. The affinity of the AR2–EBS segment (blue) for tRNAphe (dark blue) is enhanced in the presence of enolase (pink). tRNAPhe (lane 1) does not readily interact with AR2–EBS region of RNase E (lanes 2–6). However, the same region of RNase E in complex with enolase does form a super-shifted species with tRNAPhe (lanes 7–11). The RNase E 603–850+RhlB+enolase ternary complex also forms a shifted species with tRNAPhe, with a higher affinity (lanes 12–16) due to the additional presence of RhlB and RBD. (B) The crystal structure of the enolase in complex with RNase E segment C and AR2 (blue). The electron density for the AR2 is poorly resolved and the model shows only the EBS in the intra-protomer binding cleft.

