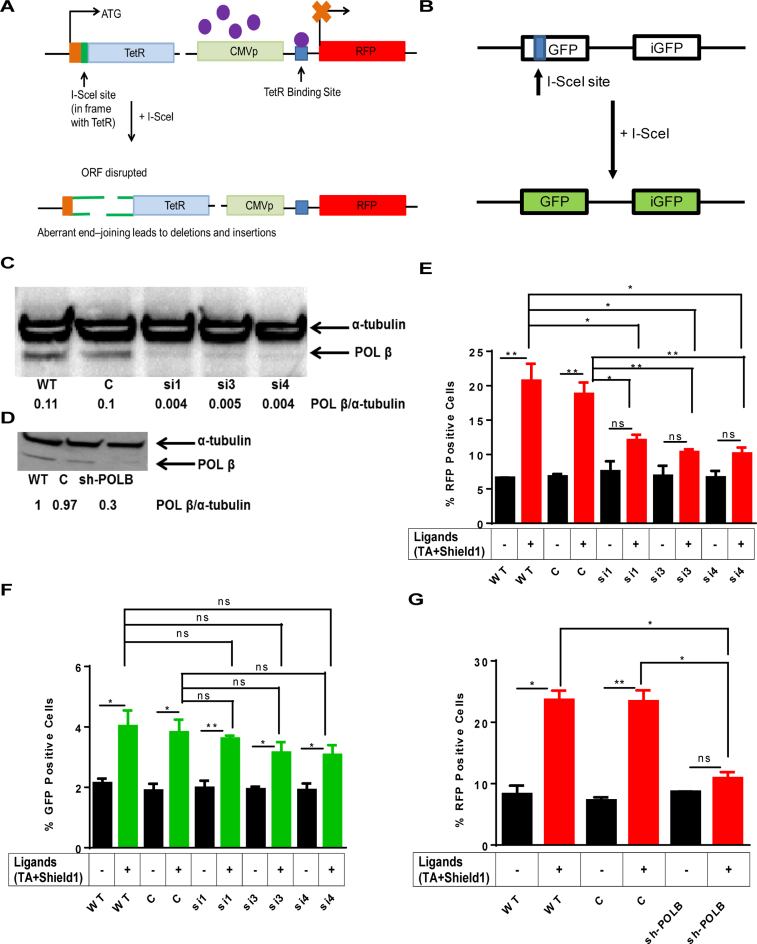
Figure 1.
(A) Schematic of the mutagenic end-joining. The aNHEJ construct consists of a TetR gene with the I-SceI endonuclease site incorporated in-frame so that Tet Repressor (TetR) is produced. It also consists the red expression protein (RFP) gene under the control of CMV promoter and the TetO binding site is in between the CMV promoter and the RFP gene. The purple circles represent the TetR that binds to the TetO and represses expression of RFP. Upon induction of I-SceI, if the TetR ORF is disrupted and if not joined correctly, results in loss of TetR binding to its recognition sequence TetO in the reporter gene plasmid, thus leading to the expression of RFP. Therefore, the loss of TetR is due to circumstances of mutagenic end-joining. (B) The GFP reporter is also shown. (C) Western blot showing depletion of Pol β using siRNA targeting of the POLB gene. WT is wild-type no treatment control, C denotes cells treated with siGENOME RISC-free negative control non-targeting siRNA, and si1, si3, and si4 denote cells treated with three different siRNAs targeting the POLB gene. α-tubulin is used as a loading control. Pol β/α-tubulin indicates the ratio of the intensity of the Pol β band over the α-tubulin band in each lane and is a reflection of the relative amount of Pol β that is depleted from the cells. (D) Western blot showing depletion of Pol β by an shRNA targeting the POLB gene. C denotes cells treated with a non-targeting shRNA, and sh-POLB denotes cells treated with an shRNA that targets the POLB gene. (E) aNHEJ is suppressed in cells treated with siRNA directed against POLB. Quantification of the flow cytometry plots for U2OS EJ-DR cells. WT, C, si1, si3 and si4 denote levels of RFP+ cells without ligands and WT+, C+, si1+, si3+ and si4+ denote RFP+ cells treated with TA and Shield1 to induce cutting at the I-SceI site. The percentage of RFP+ cells is plotted on the Y-axis. Data are graphed as mean ± SEM (n = 3) ** (P ≤ 0.0099), * (P ≤ 0.04) and P = ns (not significant). (F) HR is slightly suppressed in Pol β-depleted cells. Quantification of the flow cytometry plots for U2OS EJ-DRs cells. WT, C, si1, si3 and si4 denote levels of GFP+ cells without ligands. WT+, C+, si1+, si3+ and si4+ indicate GFP+ cells treated with TA and Shield1. C+ and si1+, si3+ and si4+. The percentage of GFP+ cells plotted on the Y-axis. Data are graphed as mean ± SEM (n = 3) ** (P = 0.003), * (P ≤ 0.04) and P = ns (not significant). (G) DNA end-joining is suppressed in Pol β-depleted cells. Pol β was depleted using an shRNA targeting the POLB gene. WT denotes mock-treated cells, C denotes cells treated with a non-targeting shRNA control and sh-POLB denotes cells treated with an shRNA targeted against the POLB gene. The percentage of RFP+ cells plotted on the Y-axis. Data are graphed as mean ± SEM (n = 3) ** (P = 0.001), * (P ≤ 0.004) and P = ns (not significant).

