Figure 6.
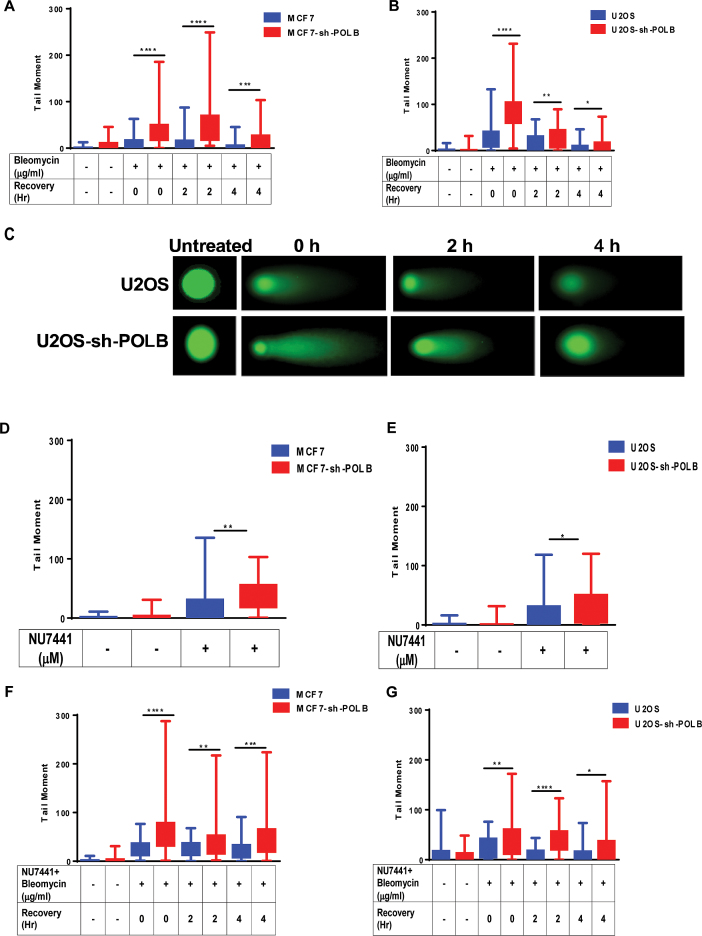
Pol β-depleted cells have increased levels of DSBs upon treatment with BLM or NU7441. (A) MCF7 and MCF7-sh-POLB cells were treated with 50 μg/ml BLM for 1 h and allowed to recover for 0, 2 and 4 h. DSBs were analyzed by the neutral comet assay. The tail moment is plotted on the Y-axis. ** (P = 0.0028); ****(P < 0.0001). (B) U2OS and U2OS-sh-POLB cells were treated with 50 μg/ml BLM for 1 h and allowed to recover for 0, 2 and 4 h. DSBs were analyzed by the neutral comet assay. The tail moment is plotted on the Y-axis. * (P = 0.03); ** (P = 0.005); ****(P < 0.0001). (C) Representative images from each time point of recovery post BLM treatment for U2OS and U2OS Pol β-depleted cells. (D) MCF7 and MCF7-sh-POLB cells were treated with 10 μM NU7441 for 24 h. DSBs were analyzed by the neutral comet assay. The tail moment is plotted on the Y-axis. ** (P = 0.0012). (E) WT U2OS and U2OS-sh-POLB cells were treated with 10 μM NU7441 for 24 h. DSBs were analyzed by the neutral comet assay. The percentage of tail DNA is plotted on the Y-axis. * (P = 0.020). (F) MCF7 and MCF7-sh-POLB cells were treated with 10 μM NU7441 for 24 h and then treated with 50 μg/ml BLM for 1 h and allowed to recover for 0, 2 and 4 h. DSBs were analyzed by the neutral comet assay. The tail moment is plotted on the Y-axis. ** (P = 0.003); *** (P = 0.0006); ****(P < 0.0001). (G) U2OS and U2OS-sh-POLB cells were treated with 10 μM NU7441 for 24 h and then treated with 50 μg/ml BLM for 1 h and allowed to recover for 0, 2 and 4 h. DSBs were analyzed by the neutral comet assay. The tail moment is plotted on the Y-axis. * (P = 0.03); ** (P = 0.009); ****(P < 0.0001).

