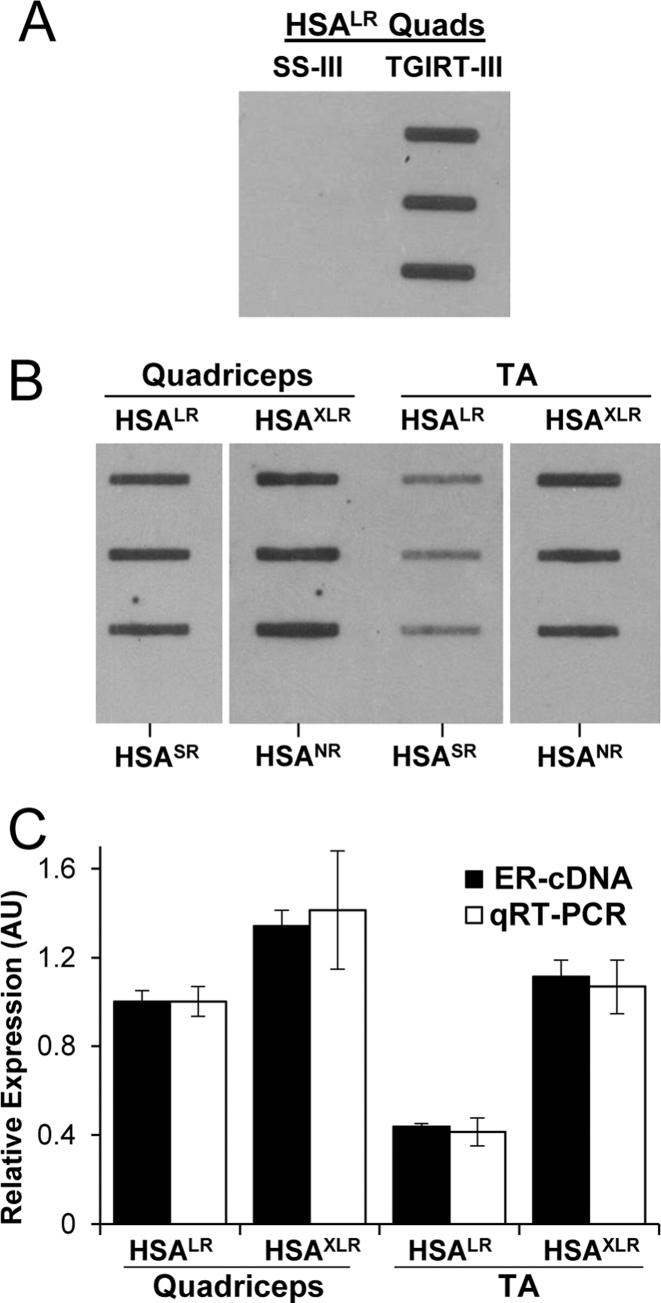
Figure 5.
ER-RNA expression in transgenic mouse models of DM1. (A) cDNA slot blot of total cellular RNA from HSALR quadriceps (Quads, 2 μg, three different mice) using Superscript-III (SS-III) or TGIRT-III. (B) cDNA slot blot of 2 μg total cellular RNA from quadriceps or tibialis anterior (TA) muscles from HSALR and HSAXLR mice. Bottom-most wells in each column are from HSASR or HSANR mice, which do not express ER-RNA. (C) Relative amount of ER-RNA by cDNA slot blot in HSALR and HSAXLR quadriceps and TA muscle (black bars, mean signal in HSALR quadriceps set to 1), as compared to inferred ER-RNA level based on qRT-PCR (white bars, calculated by multiplying expression level x repeat length, with the mean product in HSALR quadriceps set to 1). Results are based on n = 3 for HSALR and HSAXLR mice. HSA transgene expression by qRT-PCR was normalized to general transcription factor 2b (Gtf2b).

