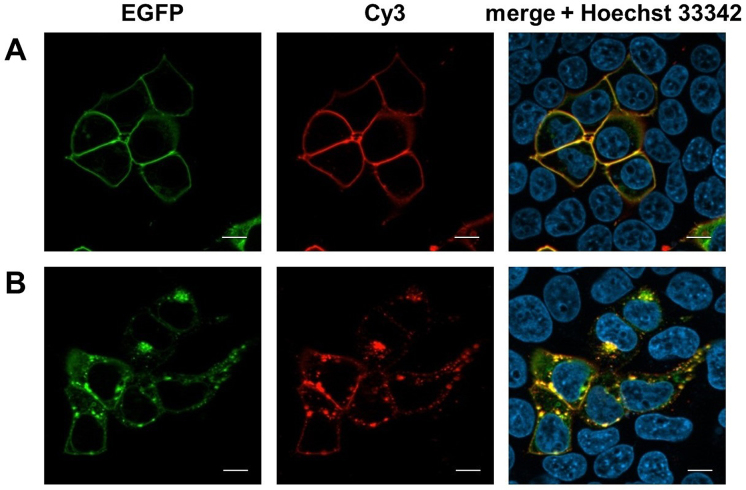
Figure 5.
GPCR labeling via SPIEDAC on live cells. Representative images in the green, red and blue channel. (A) Cells expressing CRF1R95TCO*K-EGFP were treated with Cy3-tetrazine (1.5 μM) for 5 min. Only cells expressing the receptor (green) showed Cy3 labeling (red). (B) Cy3-CRF1R95TCO*K-EGFP was activated with Urocortin1 (200 nM) and imaged after 15 min. Intracellular vesicles correspond to the internalized receptor. Scale bar: 10 μm.

