Figure 1.
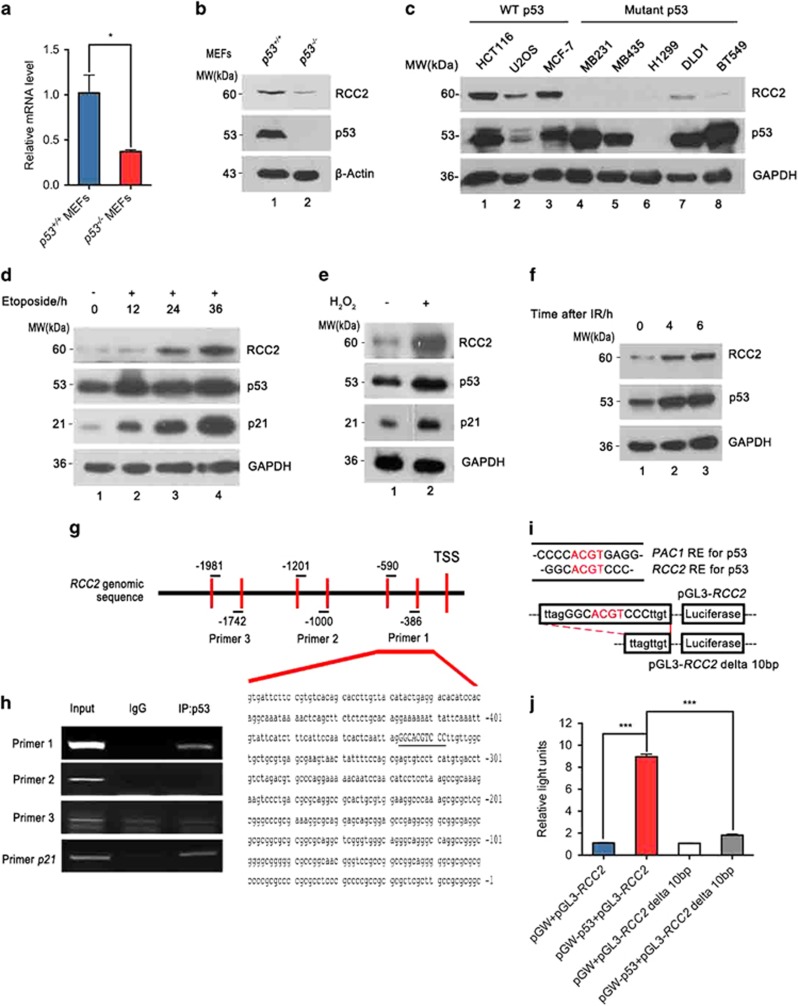
RCC2 is a transcriptional target of p53. (a) mRNA expression of RCC2 in p53−/−mouse embryonic fibroblasts (MEFs) compared with p53+/+ MEFs. Data are presented as mean±s.e.m. and were analyzed with the unpaired t-test (n=3). *P<0.05. (b) Protein expression of RCC2 in p53+/+MEFs and p53−/−MEFs. (c) Cell lines are grouped according to p53 status (wild-type (WT) or mutant). The protein levels of RCC2 and p53 in these cell lines are shown by western blot. (d) p53 and RCC2 expression under treatment with etoposide for indicated times. Expression of p21 represents p53 activity. (e) Expression of RCC2 is induced by oxidative stress. p21 is used as a marker for p53 activation. (f) HCT116 cells were irradiated with 12 Gy and recovered for the indicating time. Expression of RCC2 and p53 were evaluated with specific antibodies. (g) Locations of three pairs of primers used to amplify the RCC2 genomic sequence. Numbers indicate primer location upstream of the transcriptional start site (TSS). (h) Genomic DNA fragments precipitated from HCT116 cells by p53 were used as templates to amplify indicated RCC2 genomic sequences with specific RCC2 primers. The DNA sequence covered by the first primer is shown and the palindromic motif is underlined. Anti-p53 antibody was used to immunoprecipitate p53. Nonspecific IgG was used as a negative control and p21 primer was used as a positive control. (i) Comparison of PAC1 and RCC2 sequences, and pGL3-RCC2 and pGL3-RCC2 delta 10 bp plasmid sequences. (j) p53−/− HCT116 cells were transfected with indicated combinations of pGW-p53 and various RCC2 promoter reporter plasmid constructs using pGW and pGL3 as negative controls. Luciferase activity was measured. All data are presented as mean±s.e.m. and were analyzed with the unpaired t-test (n=3). ***P<0.001. See also Supplementary Figure S1.

