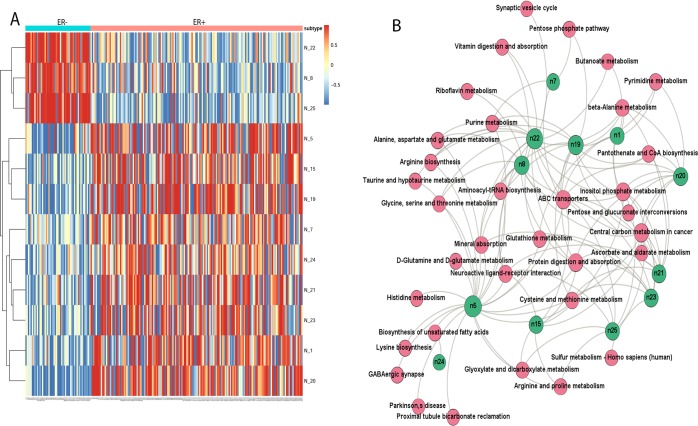
Figure 3.
Biological relevance of the DL hidden layers. (A) Activation levels of the high variance nodes extracted from the layer 1 of the DL model. Columns are samples and rows are the top 12 nodes with high variance >0.1. (B) Bipartite graph of enriched significant metabolomics pathways and top hidden nodes. The nodes represent enriched pathways common to all top 12 nodes (green color) in the first hidden layer of DL in KEGG pathway enrichment analysis (FDR< 0.05).

