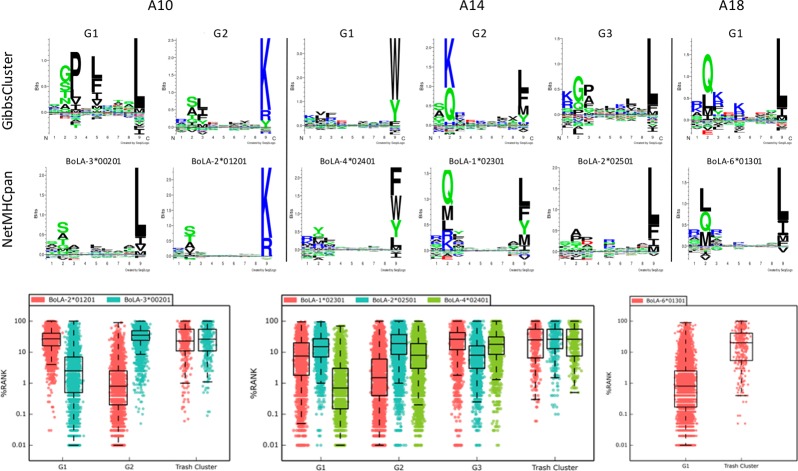
Figure 3.
Mapping of GibbsClustered peptides to BoLA-I molecule specificities. Each haplotype is shown separated by the vertical lines as indicated. In each column the binding motif logos for each of the optimal GibbsCluster solutions (upper row) together with the best-matched NetMHCpan predicted binding motif for the BoLA-I molecules (central row) expressed by the relevant haplotype are shown (as determined by visual comparison). The lower row displays boxplot representations of the NetMHCpan-3.0 percentile rank prediction values for all peptides in each GibbsCluster against all BoLA-I molecules expressed by the given haplotype.

