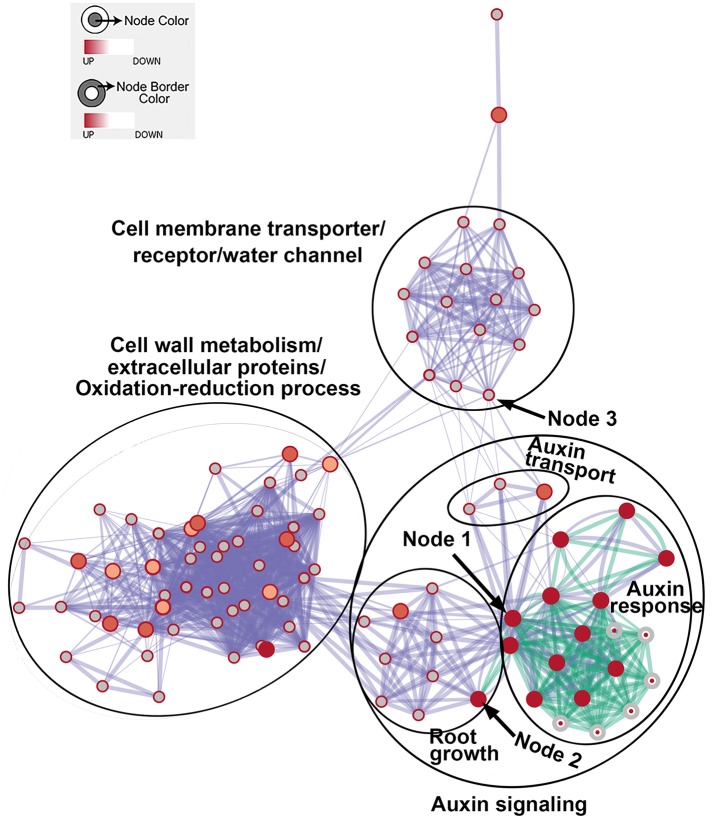
Figure 5.
The enrichment map showing differentially expressed gene-sets in roots treated by Rhizobium sp. IRBG74 for 24 and 48 h. The map displays enriched gene-sets in untreated and treated roots at 24 and 48 h. The node center represents gene-sets at 24 h, whereas the node border represents gene-sets at 48 h. Gene-sets at 24 h are connected by green lines, while gene-sets at 48 h are linked by light blue lines. The node size represents the gene-set size and line thickness indicates the degree of overlap between two gene-sets. Clusters of gene-sets were manually circled and labeled to demonstrate biological and molecular functions. Node 1 represents auxin response genes, node 2 contains genes with functions in root growth, and node 3 represents cell membrane transporter/receptor/water channel genes.

