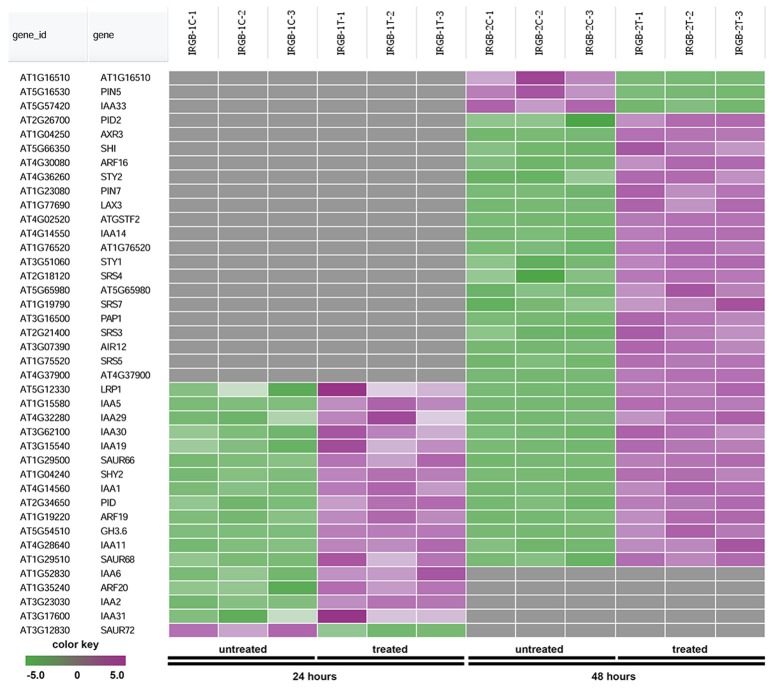
Figure 6.
Heatmap showing expression changes of representative genes related to auxin signaling. The auxin signaling subgroup in the node 1 gene-set showing in Figure 5 contains a total of 40 genes. Green color: down-regulated; Purple color: up-regulated; and Gray color: no significant expression change.

