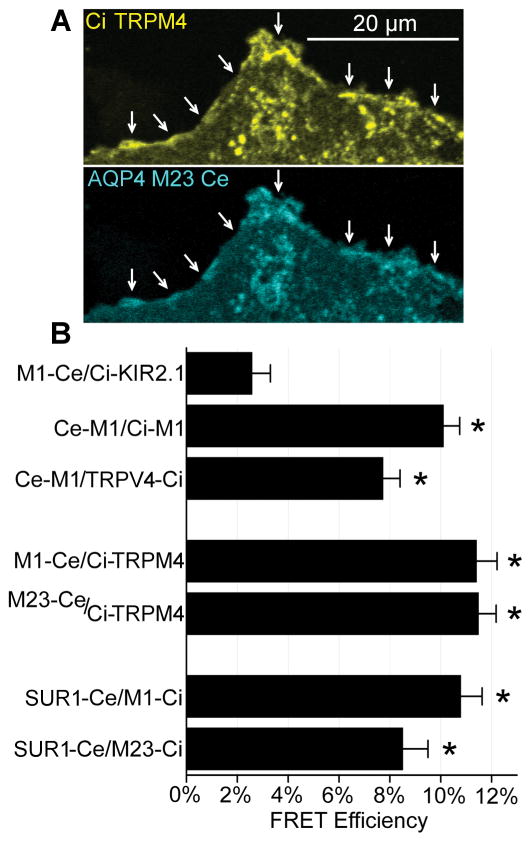
Figure 4. Quantification of FRET efficiency.
(A) Example plasmalemmal (arrows) ROI used in photobleaching quantification of FRET efficiency. (B) Quantification of FRET efficiency in COS-7 cells with acceptor photobleaching showing that the negative control (AQP4 M1-Ce with Ci-KIR2.1) exhibited ~3% FRET efficiency, positive controls (Ce-M1 with Ci-M1) (Ce-M1 and TRPV4-Ci) exhibited ~8–10% FRET efficiency, and combinations of AQP4 M1 and M23 with TRPM4 and SUR1 exhibited ~8–12% FRET efficiency; n>35 independent cells/condition; *p<0.05 t-test versus M1-Ce/Ci-Kir6.2 negative control.

