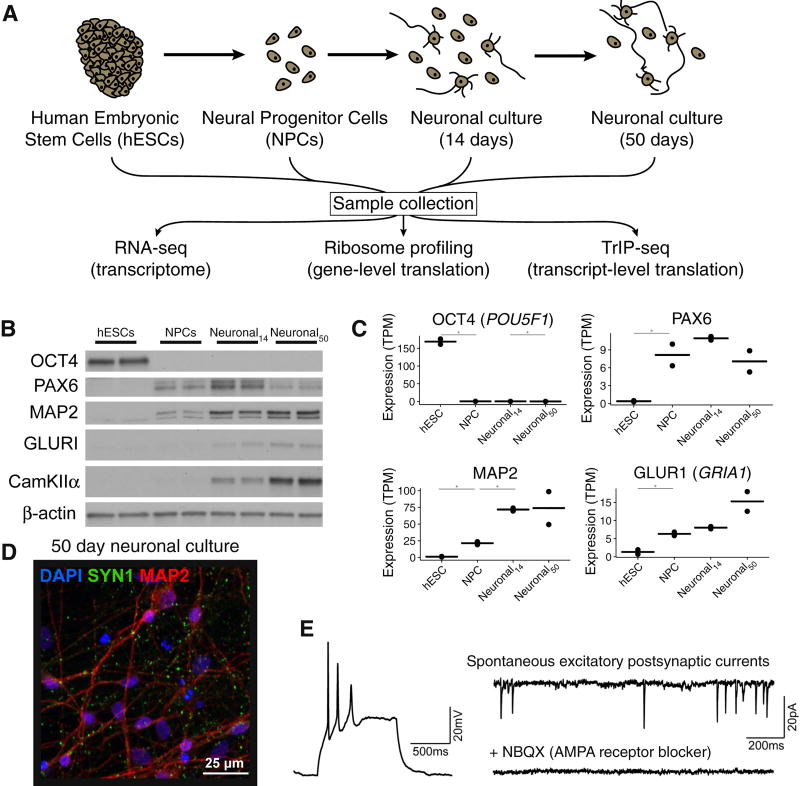
Figure 1. Measuring global changes in transcription and translation during human neuronal differentiation.
(A) The experimental design. Human embryonic stem cells (hESCs) were differentiated into neural progenitor cells using dual-SMAD inhibition followed by neuronal differentiation. Samples were collected from each cell population and RNA-seq, ribosome profiling, and TrIP-seq libraries were prepared from each. (B) Western blotting of five cell-type markers during differentiation. (C) Examples of marker genes from cytoplasmic RNA-seq. TPM: gene-level expression in transcripts-per-million. *: differentially expressed at p < 0.01. Bar: mean expression; points: expression in each replicate. (D) A representative image of 50-day old in vitro differentiated human neuronal cultures. Green: synapsin; red: MAP2; blue: DAPI. (E) Left, example whole cell current clamp recording of a neuron showing action potentials elicited by a 25pA depolarizing current injection. Right, example spontaneous excitatory post-synaptic currents (sEPSCs) showing network connectivity. sEPSCs were abolished by blocking AMPA receptors with NBQX (bottom right).See also Figure S1.

