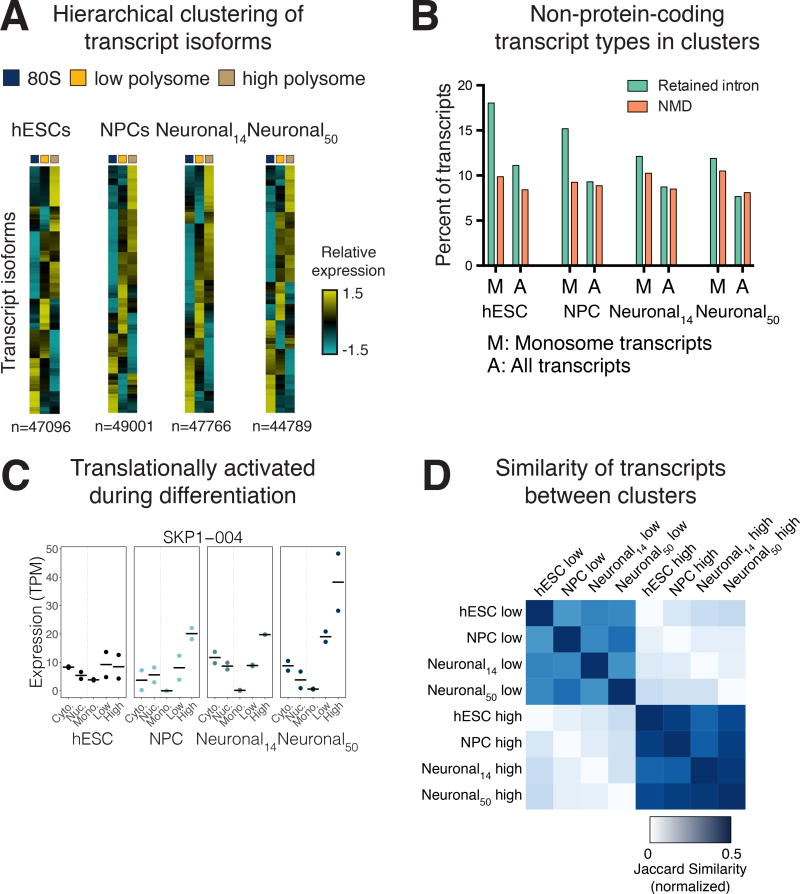
Figure 5. Trends in transcript-level translation during human neuronal differentiation.
(A) Heatmaps of hierarchical clusterings of transcript isoform expression. See Figure S3B for dendrograms and average plots. (B) Select transcript types are shown for clusters of transcripts that are primarily present in the monosome fraction. Most other transcripts are annotated as protein coding. (C) Contrasting lowly- and highly-translated clusters between cell types identifies transcripts, such as SKP1-004, that are differentially translated between cell types. Bar: mean expression; points: expression in each replicate. (D) The normalized Jaccard similarity of polysome-low and polysome-high clusters between cell types is plotted. See also Figure S3.

