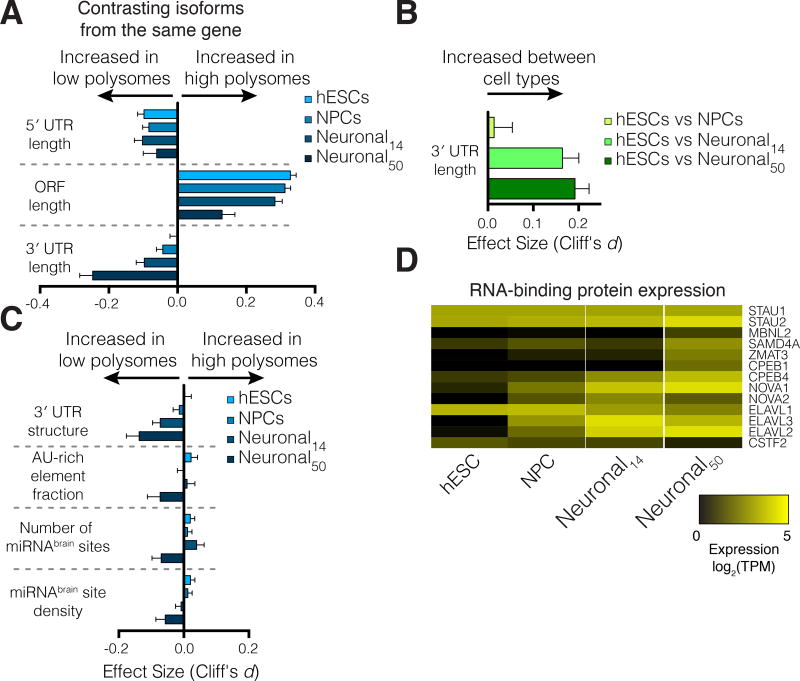
Figure 6. 3′ untranslated regions drive differential translation between cell types.
(A) The relative length of 3′ UTRs between lowly- and highly-translated transcripts from the same gene increases during differentiation. Error bars: 95% confidence interval, also in (B,C). (B) Relative 3′ UTR length increases for transcripts of the same gene expressed between cell types. (C) 3′ UTR structure, the fraction of 3′ UTRs containing AU-rich elements, and the influence of brain-specific miRNA binding sites increase in 50-day old neuronal cultures, suggesting these features may drive translational repression by 3′ UTRs. (D) Expression changes in select RNA binding proteins that influence either 3′ end selection or post-transcriptional control. See also Figure S4.

