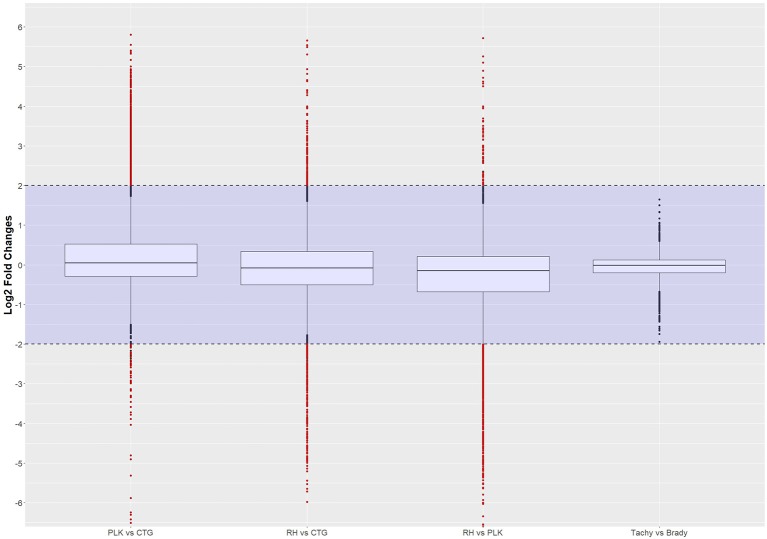
Figure 2.
Distribution of differential gene expression (log2 transformed) between strains and developmental stages. Gene expressions falling into the shaded area (violet) were not considered to be differentially regulated. Red dots outside the shaded area also pass the 0.05 p-value significance threshold. The number of differentially regulated genes is 529 for PLK vs. CTG, 328 for RH vs. CTG, 613 for RH vs. PLK, and 0 between stages. See Supplementary Table 5 for the list of gene expression.

