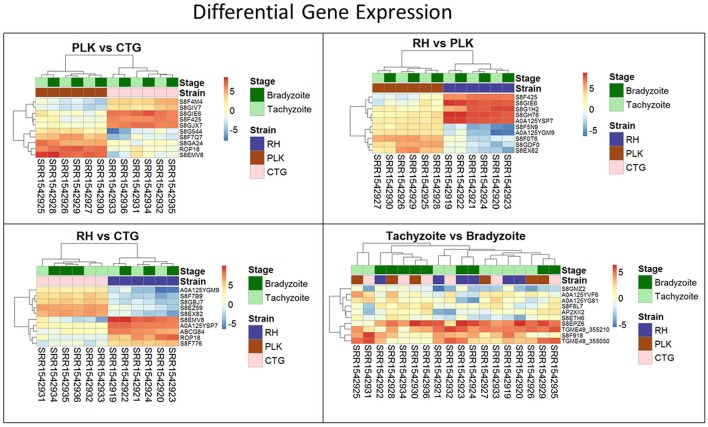
Figure 3.
Heatmaps showing the five most overexpressed genes per strain (RH: blue, PLK: brown, CTG: pink) and developmental stage (bradyzoite: dark green, tachyzoite: mint). Each pair presents 10 genes of which 5 are overexpressed in one of the strains/stages and 5 in the other. Genes are hierarchically clustered based on the expression among replicates. Overexpression was analyzed with pooled replicates, but for a better overview, all measurements are shown in columns including their hierarchical clustering. Supplementary Table 5 contains all differential expression results and additional functional annotation.

