
Fig. 5.
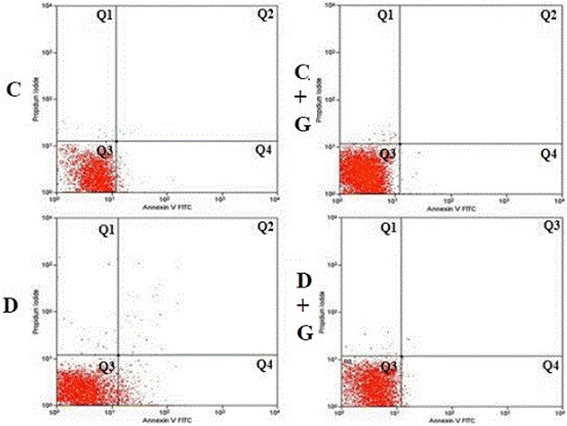
The two-dimensional histogram of apoptotic and viable lymphocytes distribution in DotPlot mode. On the horizontal axis - the intensity of annexin V - FITC fluorescence, the vertical axis - the intensity of PI fluorescence. Q3 (annexin V−/ PI−) - viable cells; Q4 (annexin V+/PI−) - cells with features of early apoptosis; Q2 (annexin V+/PI+) - cells with features of late apoptosis; Q1 (annexin V−/PI+) - cells with features of necrosis