Fig. 1.

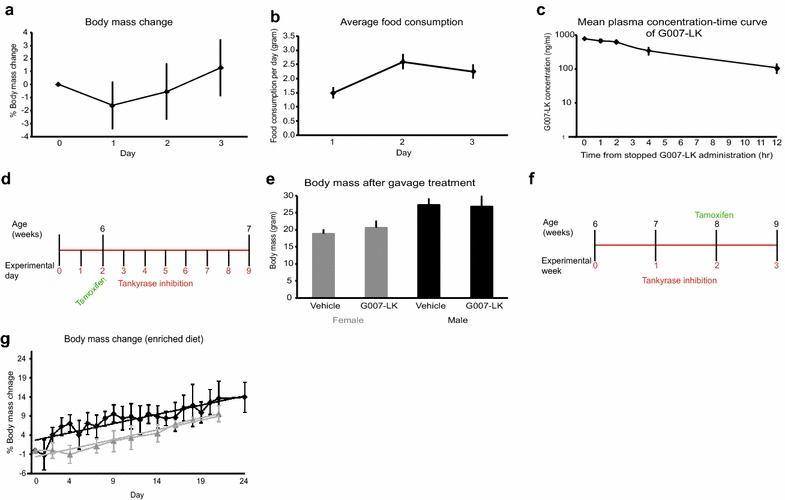
Body mass, administration schemes and pharmacokinetics of G007-LK. a Average relative change in body mass of ICR mice compared with body mass at starting day for 3 days treatment with G007-LK enriched diet (mean ± SEM, n = 25). b Average food consumption for ICR mice fed G007-LK enriched chow for 3 days (mean ± SEM, n = 25). c Mean plasma concentration time curve of G007-LK in mice following administration of G007-LK enriched chow (100 mg/kg chow) for 3 days (n = 5), measured at 0, 1, 2, 4 and 12 h after termination of G007-LK treatment (mean ± S.D). d Administration schema for G007-LK by oral gavage, short-term. Tamoxifen was administered by i.p. injection, when indicated, to induce lineage tracing from LGR5+ cells. e Body mass of mice measured at the end of the short-term G007-LK administration protocol (mean ± SEM, n ≥ 4). f Administration schema for G007-LK by enriched chow, long-term. Tamoxifen was administered by i.p. injection, when indicated, to induce lineage tracing from LGR5+ cells. g Average relative change in body mass of male mice compared to body mass at starting day for long-term treatment with G007-LK enriched diet (black line) and control treated mice (grey line) (mean ± SEM, n ≥ 3). Linear regression modelling of the body mass developments is indicated with straight lines, same colour coding as for the corresponding observed data
