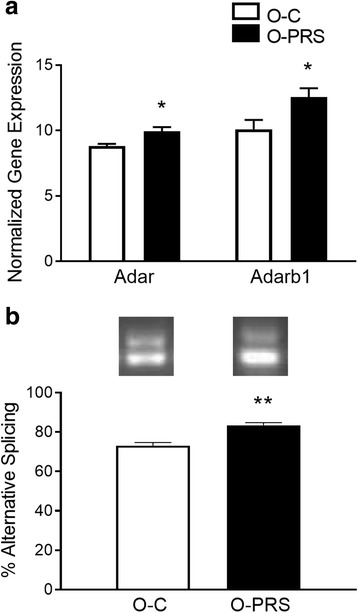
Fig. 6.

Relationship between mRNA expression and alternative splicing of Adarb1 in rat brain. a mRNA expression of Adar and Adarb1 in O-C and O-PRS brains. b Reverse Transcription-PCR of alternative splicing in Adarb1. Upper and lower bands represent inclusion or exclusion, respectively, of the 47 nt sequence in O-C and O-PRS brain at P0 (top). Mean Adarb1 alternative splicing levels in O-C and O-PRS brain at P0. *p < 0.05, **p < 0.001. N’s, Adar: O-C 10, O-PRS 9; Adarb1: 10, 10; Splicing: 9, 9
