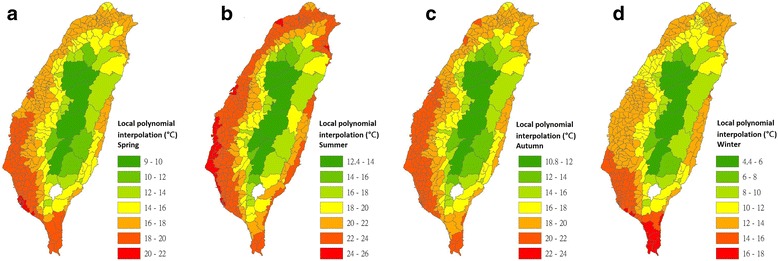
Fig. 5.

Maps of nighttime land surface temperatures in 348 townships for each season that were interpolated using the local polynomial interpolation model (2009–2011). a Interpolated estimates for spring. b Interpolated estimates for summer. c Interpolated estimates for autumn. d Interpolated estimates for winter
