Fig. 3.

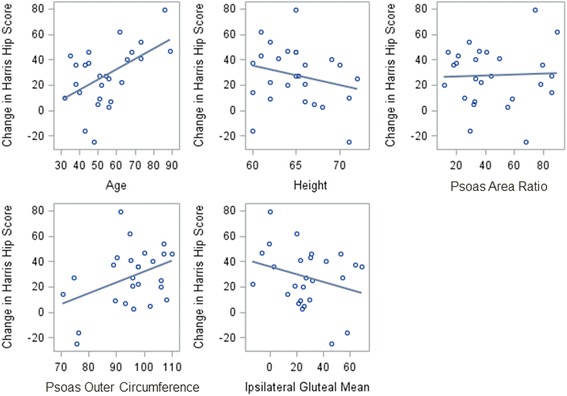
Scatterplots of significant univariate correlations between change in HHS vs. demographic and CT parameters. The line shown is the linear, univariate correlation

Scatterplots of significant univariate correlations between change in HHS vs. demographic and CT parameters. The line shown is the linear, univariate correlation