Figure 4.

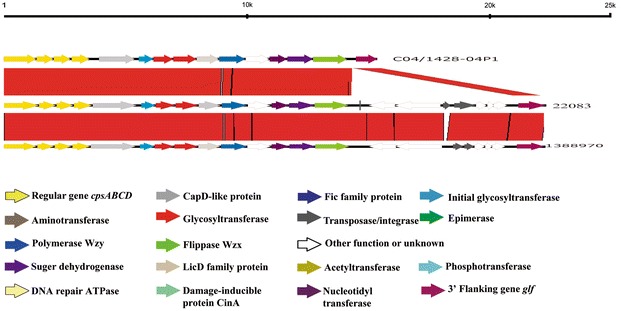
Comparison of the cps loci among S. suis serotype 9 strains. Each colored arrow represents a gene whose predicted function is shown in the blown-up panel. The glf gene is located on the 3′ side of each locus.

Comparison of the cps loci among S. suis serotype 9 strains. Each colored arrow represents a gene whose predicted function is shown in the blown-up panel. The glf gene is located on the 3′ side of each locus.