Fig. 6.

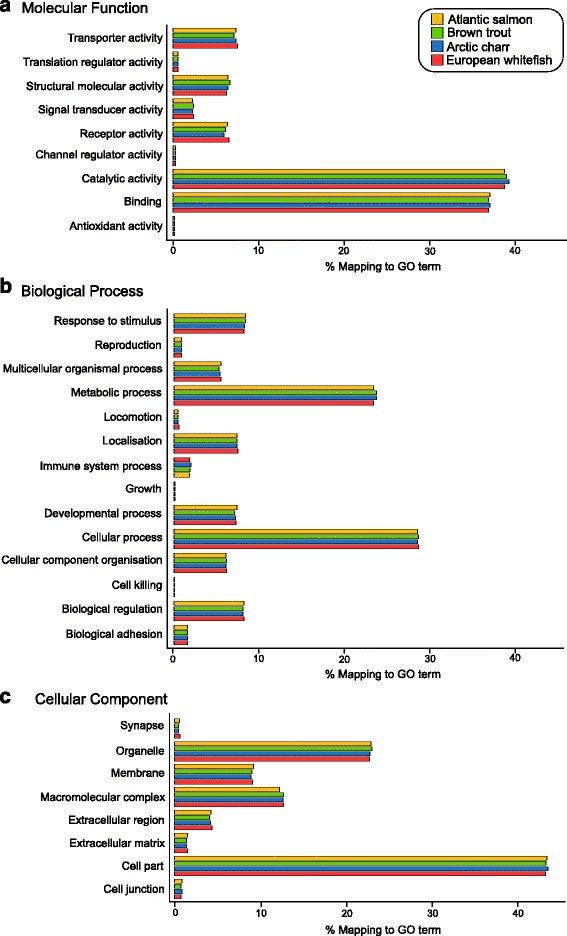
Proportions of gene ontology annotations for transcripts of Atlantic salmon (yellow), brown trout (green), Arctic charr (blue) and European whitefish (red): a molecular function, b biological process and c cellular component

Proportions of gene ontology annotations for transcripts of Atlantic salmon (yellow), brown trout (green), Arctic charr (blue) and European whitefish (red): a molecular function, b biological process and c cellular component