
Fig. 7.
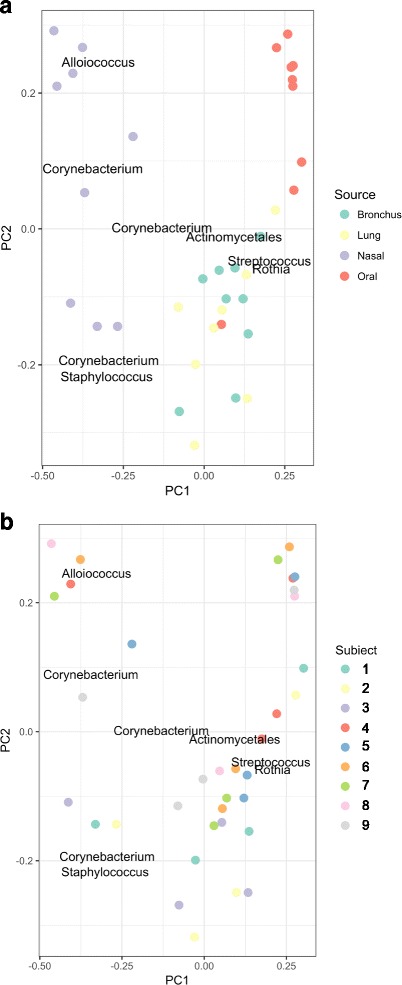
Principal coordinate analysis demonstrates clustering by anatomic site. PCoA of the β-diversity data set using Bray-Curtis distance was performed using QIIME and R following batch-effect correction. (a) Oral samples (red) cluster at upper right while nasal samples (purple) are found on the left. Bronchial and peripheral lung samples cluster together in the lower right of the figure. Alloiococcus, Corynebacterium, and Staphylococcus are associated with nasal samples while Actinomycetales, Streptococcus, and Rothia are associated with bronchial and peripheral lung samples. When all 35 samples are analyzed, clustering by anatomic site is observed (PERMANOVA p = 0.001; r2 = 0.275; heterogeneous dispersion). (b) Samples were color-coded by subject (see legend). When all 35 samples were included in the analysis, there was no clustering by subject (PERMANOVA p = 0.44; r2 = 0.238; homogeneous dispersion)