
Fig. 1.
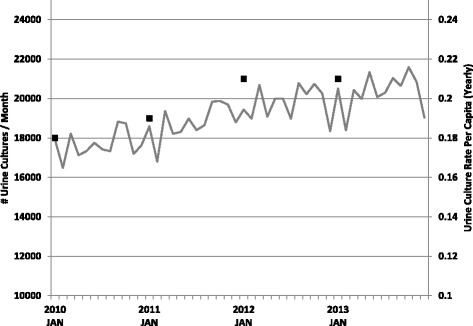
Urine culture testing at CLS from January 1, 2010 to December 31, 2013 presented as the number of urine culture tests per month (grey line) and the yearly per capita urine culture test rate (black squares)
Official websites use .gov
A
.gov website belongs to an official
government organization in the United States.
Secure .gov websites use HTTPS
A lock (
) or https:// means you've safely
connected to the .gov website. Share sensitive
information only on official, secure websites.
Urine culture testing at CLS from January 1, 2010 to December 31, 2013 presented as the number of urine culture tests per month (grey line) and the yearly per capita urine culture test rate (black squares)