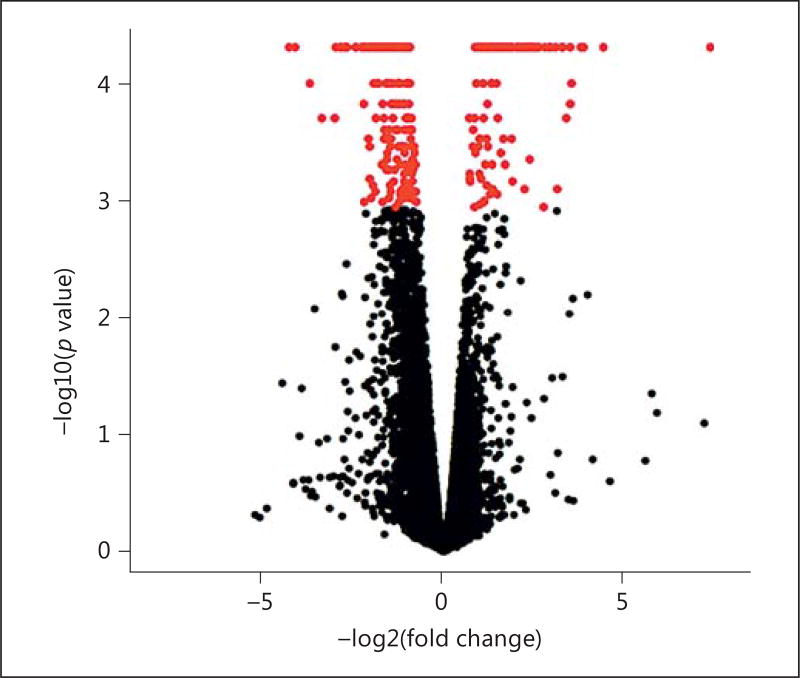
Fig. 3.
Volcano plot generated to show the differentially expressed genes resulting from the MSNP1AS knockdown. Each dot represents a change in gene expression, with genes above the FDR-corrected significance threshold shown in red (color in the online version only).

