
Fig. 2. Optimization of the AlphaLISA protocol.
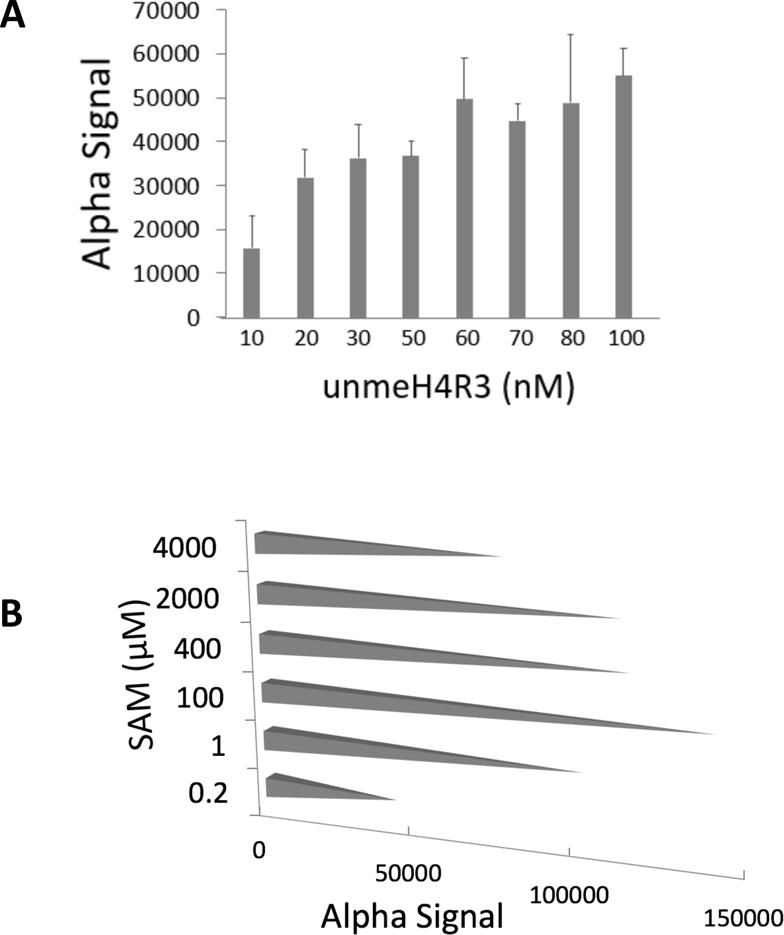
(A) Alpha signal graph, showing that the Alpha signal increased with increased substrate (Biotin-unmeH4R3) concentrations (10–100nM). (B) Alpha signal graph, showing that increased concentrations of the methyl donor SAM (0.2–4000μM) led to bell-shaped distribution of Alpha signal strength. We observed an increase in the Alpha signal, with a peak at 100μM of SAM, followed by a subsequent decrease with further increased SAM concentrations.