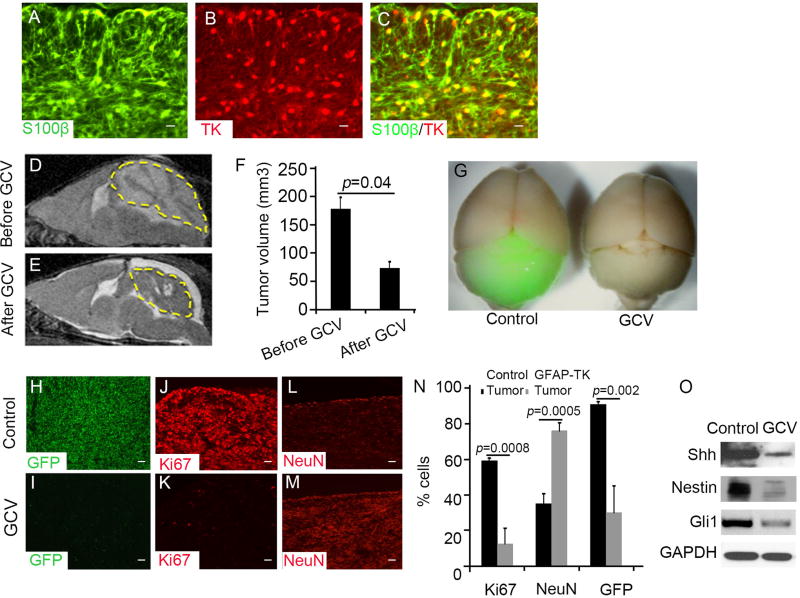
Figure 6. TAA are required for MB progression.
A–C, Sagittal sections from Math1-Cre/Ptch1fl/fl/GFAP-TK mice at 8 weeks of age, were immunostained for S100β (A) and TK (B). A merged image (C) shows TK positive cells expressed S100β. D and E, Tumor volume of MB from a Math1-Cre/Ptch1fl/fl/GFAP-TK mouse before (D) and after treatment (E) with GCV for 7 days, was measured by MRI. The yellow dotted lines circle the tumor mass. F, MB tumor volume was quantified based on MRI images using Image J software. G, Whole mount brain images of Math1-Cre/Ptch1fl/fl/GFAP-TK/Nestin-CFP mice treated with saline (control) or GCV for 7 days. H–M, Sagittal sections of MB tissues from Math1-Cre/Ptch1fl/fl/Nestin-CFP/GFAP-TK mice following treatment with saline (H, J and L) or GCV (I, K and M) for 3 days, were immunostained for CFP (H and I), Ki67 (J and K) or NeuN (L and M). N, The percentage of Ki67, NeuN or Nestin-CFP positive cells in MB tissues after treatment with saline or GCV were quantified. O, Expression of Nestin, Gli1, Shh or GAPDH proteins in Math1-Cre/Ptch1fl/fl/Nestin-CFP/GFAP-TK MB tissue treated with saline or GCV for 3 days, was examined by western blotting. Data in figure F and N represent means ± SEM from three independent experiments. Scale bar, 10 µm.

