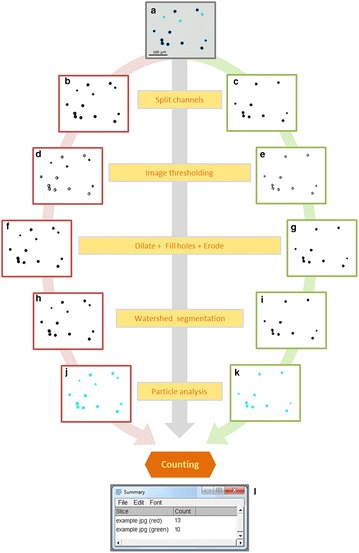
Fig. 1.

PollenCounter pipeline for the automated detection and counting of total and viable pollen grains. In a, an input RGB image of grapevine pollen grains after Alexander’s modified staining is shown (dark pollen grains are viable, whilst pale grains are sterile). This image is firstly segmented into its primary colors, and the color fractionated grayscale pictures for the red (b) and green (c) channels are taken for their parallel analysis (red and green image frame lines, respectively). Images are then segmented into black regions of interest (pollen grains) and a homogenous white background (d, e). Regions of interest are closed and filled with black pixels (f, g) before the use of a watershed algorithm for the separation of touching regions of interest (h, i). Identified pollen grains are then counted, and output images (j, k) are automatically saved as.jpg files. Note that in these images, counted pollen grains are automatically colored in cyan. In l, an example of the output pivot table with the counting results in both channels is shown. The main commands implemented in PollenCounter are indicated in yellowish boxes (grey arrow). For simplification, only a representative area of one of the processed images from cv. Vermentino is presented
