
Fig. 7.
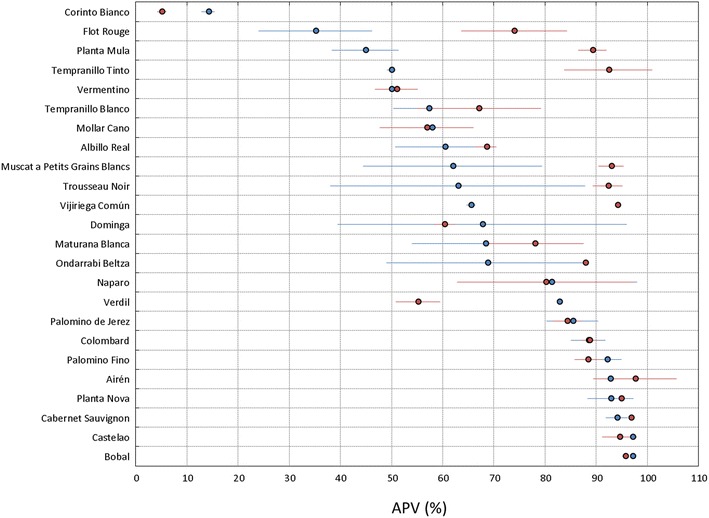
Automatic pollen viability rates [APV (%)] for 24 grapevine cultivars in 2015 (blue) and 2017 (red) obtained with PollenCounter. Dots indicate average values, whereas whiskers show standard deviations between inflorescences
Official websites use .gov
A
.gov website belongs to an official
government organization in the United States.
Secure .gov websites use HTTPS
A lock (
) or https:// means you've safely
connected to the .gov website. Share sensitive
information only on official, secure websites.
Automatic pollen viability rates [APV (%)] for 24 grapevine cultivars in 2015 (blue) and 2017 (red) obtained with PollenCounter. Dots indicate average values, whereas whiskers show standard deviations between inflorescences