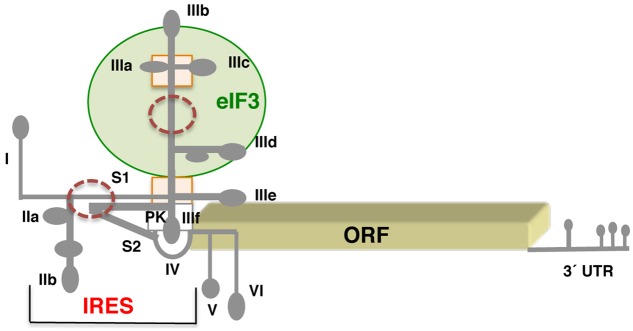
FIGURE 3.
Schematic representation of the hepatitis C genome. Secondary structure of the HCV virus IRES flanked by stem loop I at the 5′ end, and hairpins V and VI at the 3′ end. Subdomains IIa,b, IIIa,b,c,d,e, and domain IV of the IRES are indicated. S1 and S2 denote short stems surrounding the pseudoknot (PK). A green circle denotes the domain III region involved in eIF3 interaction; a rectangle depicts a four-way junction in domain III; brown circles denote regions of local flexibility. The 3′ UTR contains several stem-loops, but is not polyadenylated.

