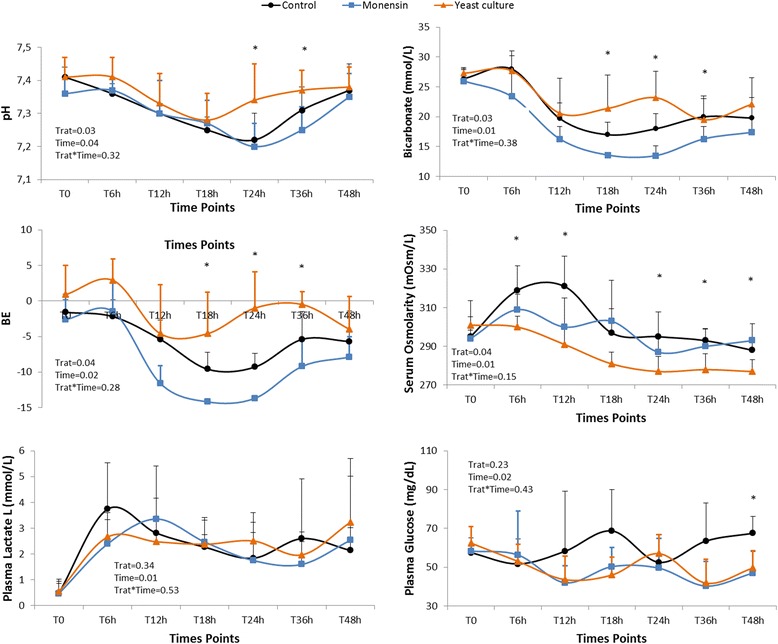
Fig. 1.

Means and standard deviation of blood variables of the control group and the groups supplemented with monensin or yeast after induction of acute ruminal lactic acidosis. Blood pH (Trat = 0.03; Time = 0.04; Trat*Time = 0.32); bicarbonate ((Trat = 0.03; Time = 0.01; Trat*Time = 0.38); base excess (BE) (Trat = 0.04; Time = 0.02; Trat*Time = 0.28); serum osmolarity (Trat = 0.04; Time = 0.01; Trat*Time = 0.15); Plasma lactate (Trat = 0.34; Time = 0.01; Trat*Time = 0.53) and plasma glucose (Trat = 0.23; Time = 0.02; Trat*Time = 0.43). *Denotes statistically significant difference (p < 0.05) between the experimental groups at the time of evaluation throughout least square means test
