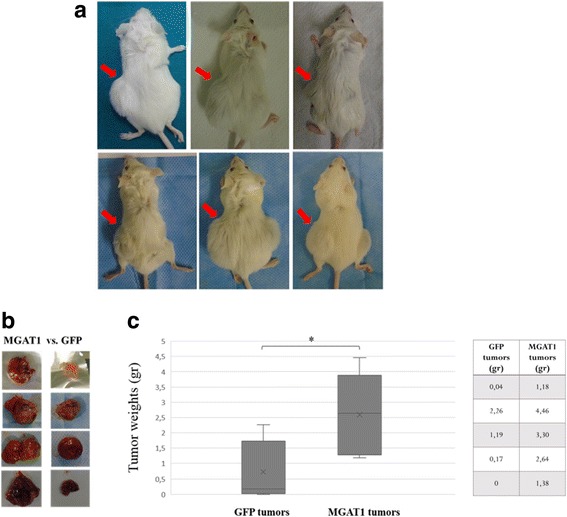
Fig. 5.

MGAT1 overexpressing stable cells are subcutaneously injected into the left flank region of each mouse (indicated by the red arrows). GFP overexpressing stable cells are injected into the right flank as control (a). Representative tumor images were obtained for comparison (b). Box plots of tumor weights of two mice groups corresponding to GFP and MGAT1 tumors and the weights are depicted as table in the right panel (c). Error bars: SD, (*p value < 0.05). The graph indicates results from 5 SCID mice for each group
