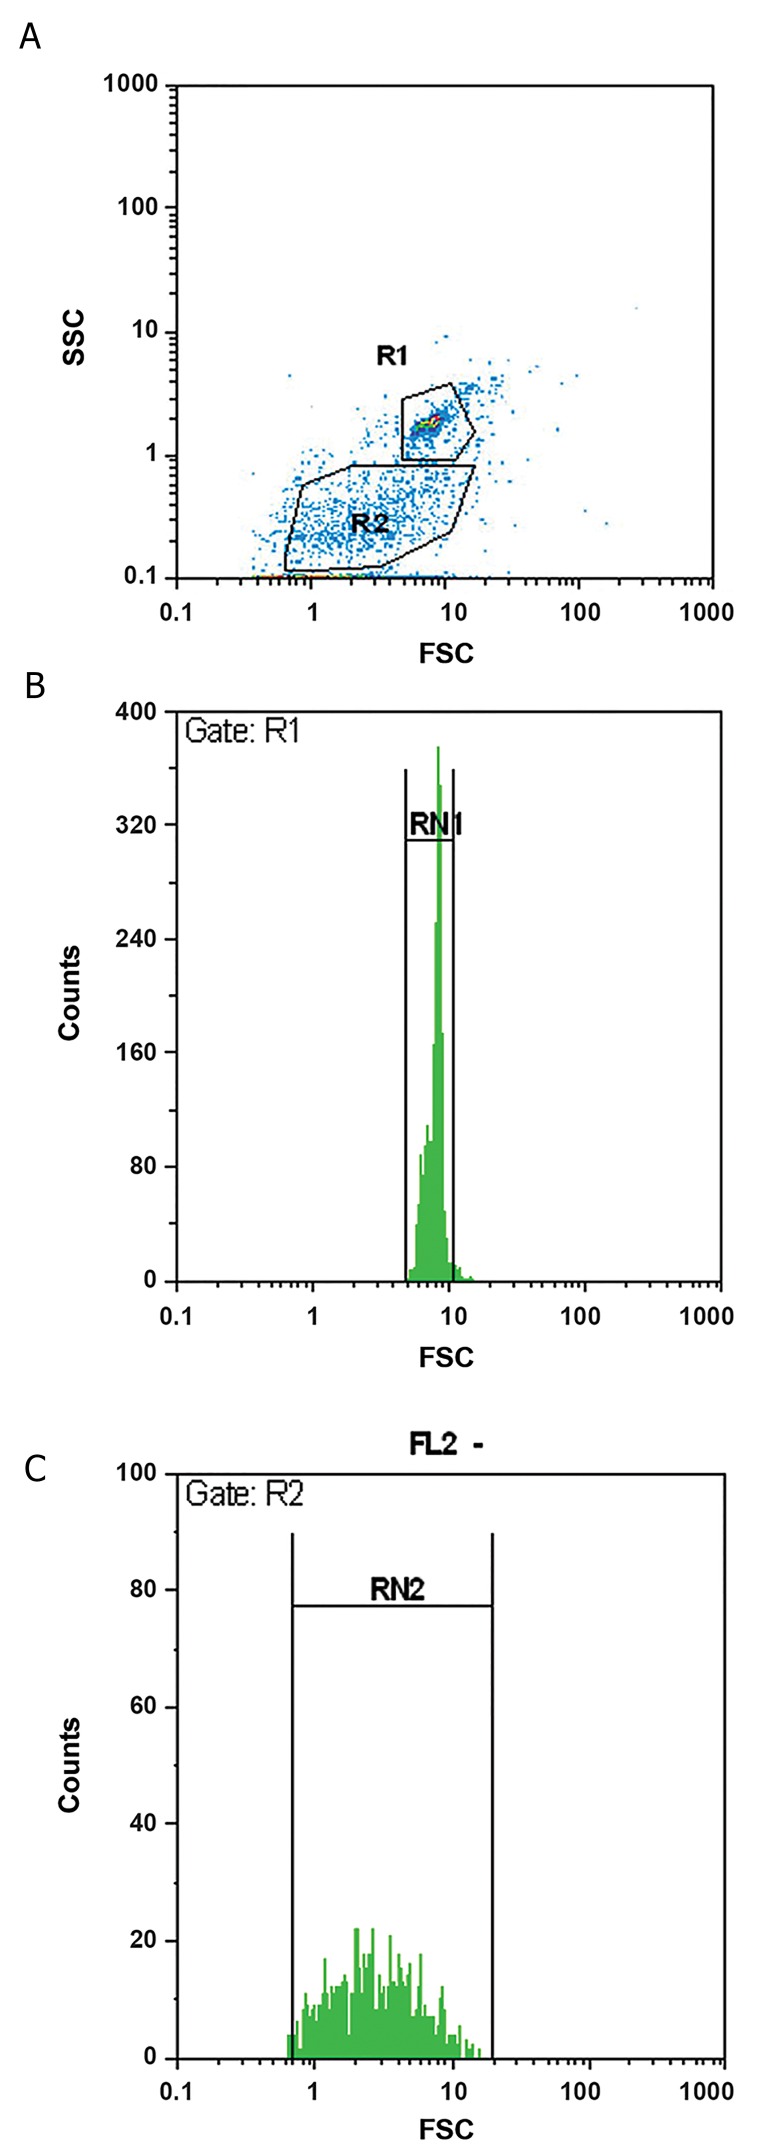
Fig.1.
Flow cytometer plot and size distribution of platelet microparticles. Comparison of the size of fluorescent microspheres (1 µm microbeads) and unknown sized microparticles. Images represent, A. Gating of the microbeads (R1) and microparticles (R2), B. Diagram for the size range of microbeads, and C. Diagram for the size range of microparticles. The figure shows a smaller size and more heterogeneity in the size for platelet microparticles compared to 1 µm microbeads.

