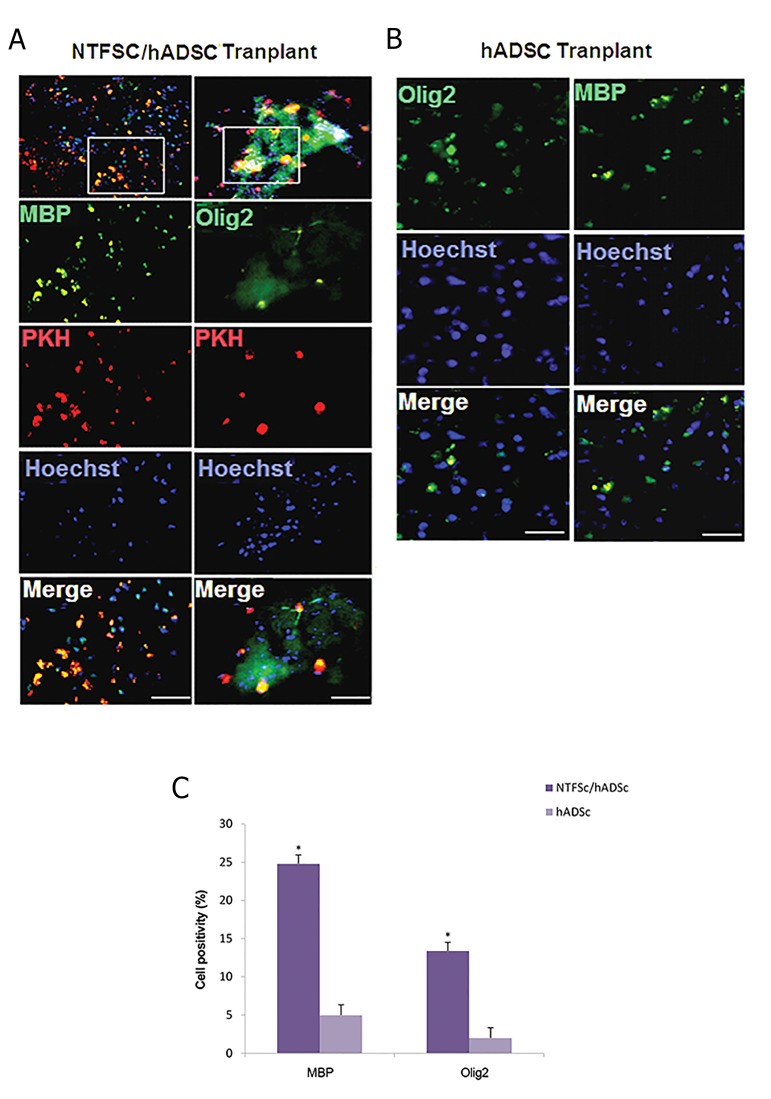
Fig.3.
Longitudinal sections of lysolecithin lesions and immunohistochemistry staining four weeks after cell transplantation. A, B. NTF-SCs were pre-labeled with PKH26 (red) and hADSCs were pre-labeled with Hoechst (blue) to show all the cells, and C. In NTF-SCs/ hADSCs transplantationgroup the presence of Olig2 and MBP positive cells were significantly higher as compared to hADSCs transplantation group (*; P<0.05) (scalebars=100 µm).

