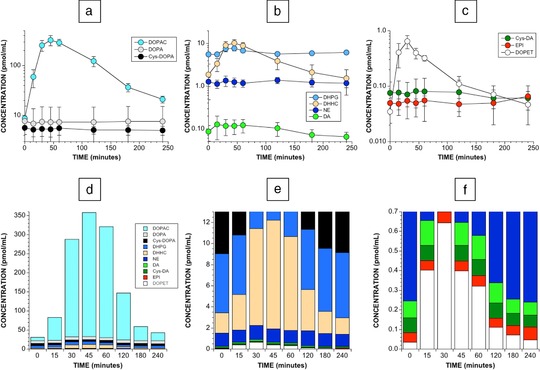
Figure 3.

Plasma catechols after olives ingestion. Shown are mean (±SEM) plasma levels of (a) DOPA, DOPAC, and Cys‐DOPA; (b) DHPG, DHCA, NE, and DA; and (c) Cys‐DA, EPI, DOPET as a function of time after eating 10 Kalamata olives in six healthy fasting volunteers. Panels d–f show stack diagrams of the same data but progressively more sensitive y‐axis scales. Note marked proportionate increases in DOPAC, DHHC, and DOPET. As illustrated in panel d, the sum of 10 assayed catechols increased by up to about 12‐fold after olives ingestion.
