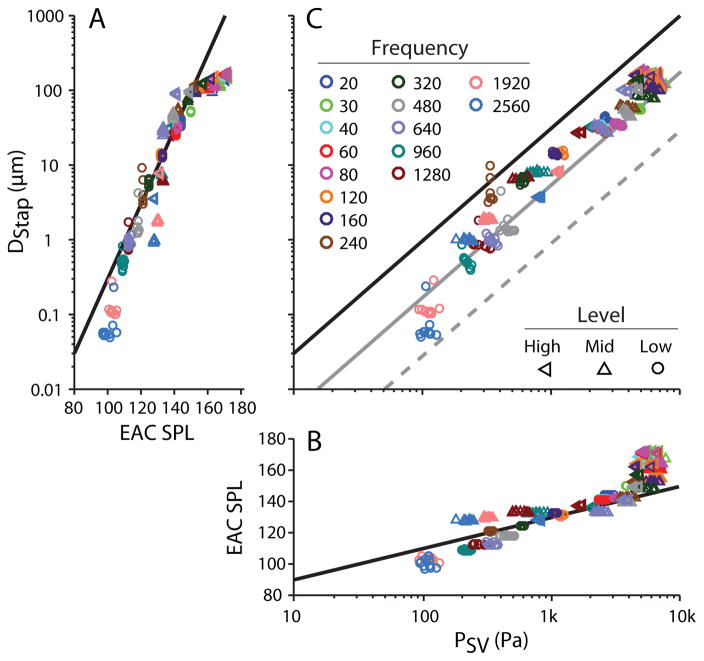
Fig. 10.
Peak-to-peak stapes displacement (DStap) (A) and scala vestibuli pressure (PSV) (B) as compared to PEAC SPL, and to one another (C), for the same specimen as in Figs. 3 & 6 (48L), across the three levels tested (identified by marker shape), separated by frequency (in Hz, identified by marker color). Markers represent the response to a single stimulus presentation, and all repetitions for a given stimulus are shown. Diagonal lines represent: in A: (DStap), an arbitrary 20 dB per decade line; in B: (PSV), an arbitrary 20 dB per decade line; and in C: the diagonals in A & B transferred onto these axes (black), as well as this line shifted towards higher pressures by 10 (gray solid) and 20 dB (gray dashed).

