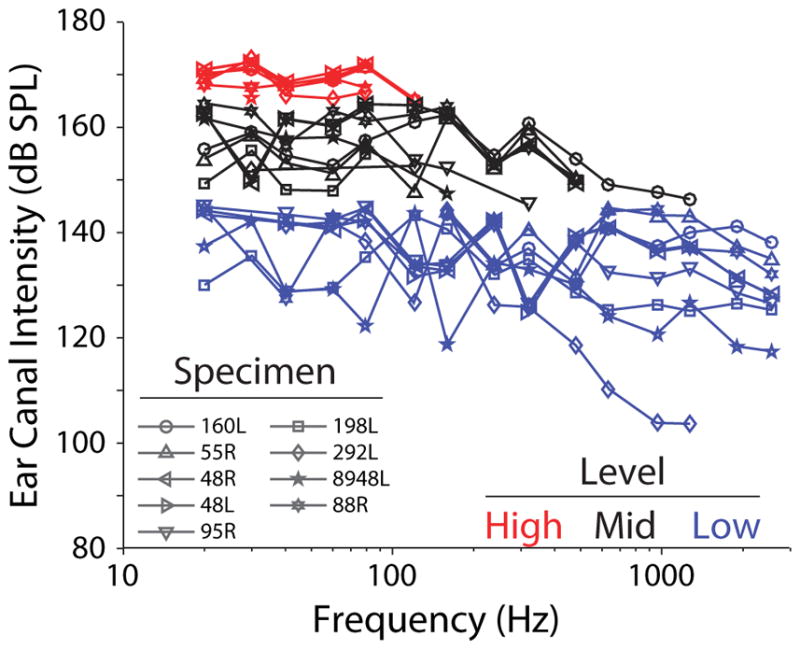
Fig. 2.

Sound pressure levels in the ear canal (PEAC) during recordings. Specimen number is indicated by marker symbol. Sets of recordings with roughly comparable levels are grouped by color and are analyzed independently in subsequent analyses (grouped as Low < 145 dB SPL, Mid ≥ 145 dB SPL & < 165 dB SPL, and High ≥ 165 dB SPL). Lines link the responses of individual specimens within each level group.
