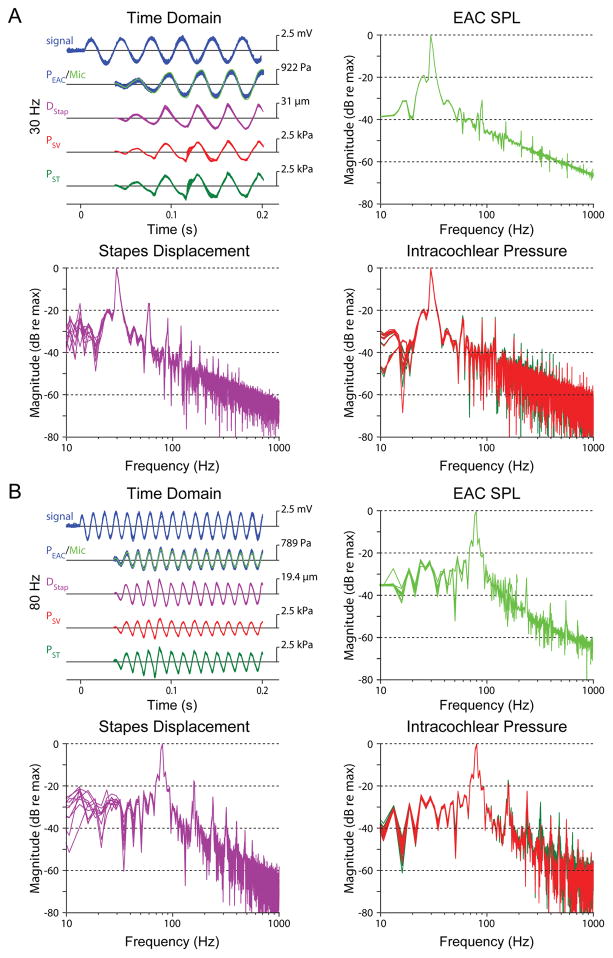
Fig. 3.
Examples of the stimulus waveform (signal, blue), sound pressure in the external auditory canal near the tympanic membrane recorded with a probe-tube microphone (Mic, light green), and a fiber optic pressure sensor (PEAC, blue) stapes displacement (DStap, violet), and intracochlear pressures measured in the scala vestibuli (PSV, red) and scala tympani (PST, green), recorded during ten presentation of a 30 Hz (A) and 80 Hz (B) tones presented at Mid (~150 dB SPL) sound pressure levels in specimen 48L. Each line represents the response recorded to a single stimulus presentation. The frequency spectrum of each signal is shown in panels not labeled “Time Domain” (at right and below), normalized to the amplitude at the stimulus frequency. For clarity, the output spectrum of the fiber optic pressure sensor in the EAC is not shown on the microphone panels.

