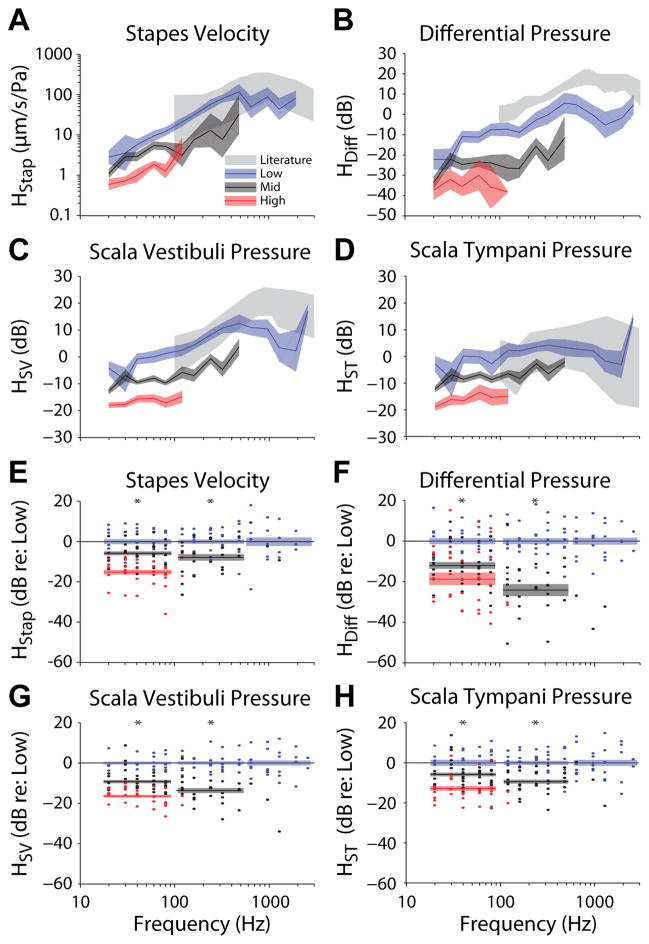
Fig. 8.
Comparison of transfer function magnitudes across the three stimulus levels presented for (A) Stapes velocity (HStap), (B) differential (HDiff), (C) scala vestibuli (HSV) and (D) scala tympani (HST) pressures. Lines and colored areas represent the mean and SEM range, respectively, for TF magnitude across specimens. Gray bands represent the 95% CI for stapes velocity from Rosowski et al. (2007), and the range of responses reported for intracochlear pressures by Nakajima et al. (2009). Transfer function magnitudes are shown normalized to the mean Low response (in dB) at each frequency measured for (E) stapes velocity, (F) differential, (G) scala vestibuli and (H) scala tympani pressures. Dots indicate measurements from individual specimens, colored bars indicate the mean ± SEM of the normalized responses at each level (for frequencies < 100 Hz, > 100 Hz & < 500 Hz, and > 500 Hz), and asterisks indicate significance as assessed via 1-way ANOVA within each frequency band. Note, comparisons including High level responses (red) were only made within the lowest frequency band, and comparisons of Mid and Low levels were not computed at the highest frequency band.

