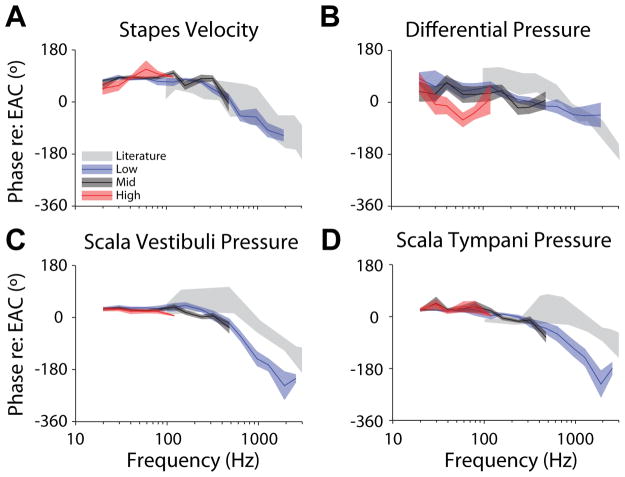
Fig. 9.
Comparison of transfer function phases (relative to PEAC SPL) across the three stimulus levels presented for (A) stapes velocity, as well as (B) differential, (C) scala vestibuli and (D) scala tympani sound pressures. Lines and colored areas represent the mean and ±SEM range, respectively, for TF phase across specimens. Gray bands represent the 95% CI for stapes velocity from Rosowski et al. (2007), and the range of responses reported for intracochlear pressures by Nakajima et al. (2009).

