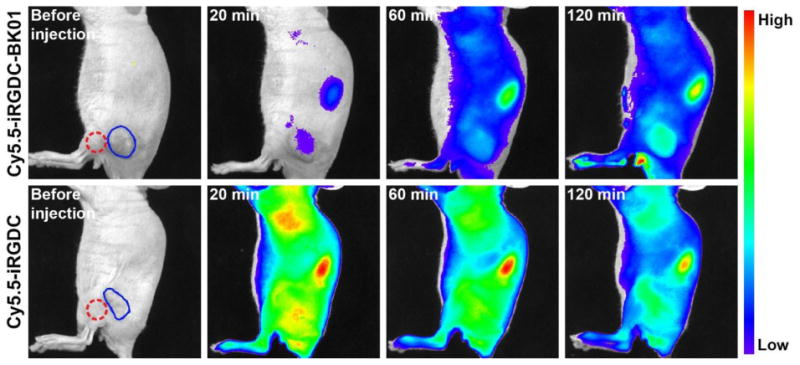
Fig. 3.

In vivo fluorescence images of U-87 MG tumor-bearing mice before and after intravenous injection of Cy5.5-iRGDC-BK01 and Cy5.5-iRGDC (50 μM). Blue and red circles indicate the tumor and the normal thigh regions nearby the tumor, respectively. The scales of the fluorescence intensity were adjusted to make maximum-to-minimum ratios of average tumor intensity the same.
