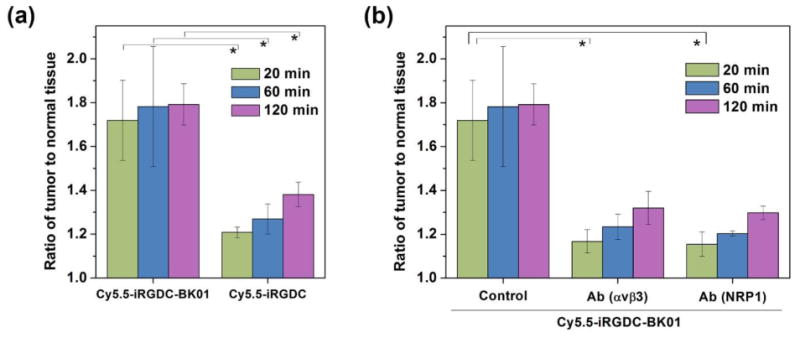
Fig. 4.

In vivo fluorescence intensity ratios of iRGD probes between tumor and normal tissues. (a) Comparison between probes with and without quencher conjugation (Cy5.5-iRGDC-BK01 and Cy5.5-iRGDC). (b) Receptor inhibition test by anti-αvβ3 antibody or anti-NRP-1 antibody to block binding or internalization function of Cy5.5-iRGDC-BK01. All tumor-to-normal fluorescence intensity ratios were calculated from the ROIs of tumor and normal tissues (blue and red circles in Fig. 3, respectively) at selected time points (20, 60, and 120 min). Error bars are presented as standard deviation (n = 3), and the statistical analysis was evaluated according to one-way ANOVA (*p < 0.05).
