Fig. 2.

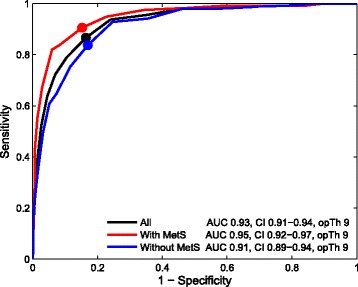
The areas under the ROC curves and the optimal thresholds of the HADS-A for current MDE in all study participants, subjects with MetS and subjects without MetS

The areas under the ROC curves and the optimal thresholds of the HADS-A for current MDE in all study participants, subjects with MetS and subjects without MetS