
Fig. 2.
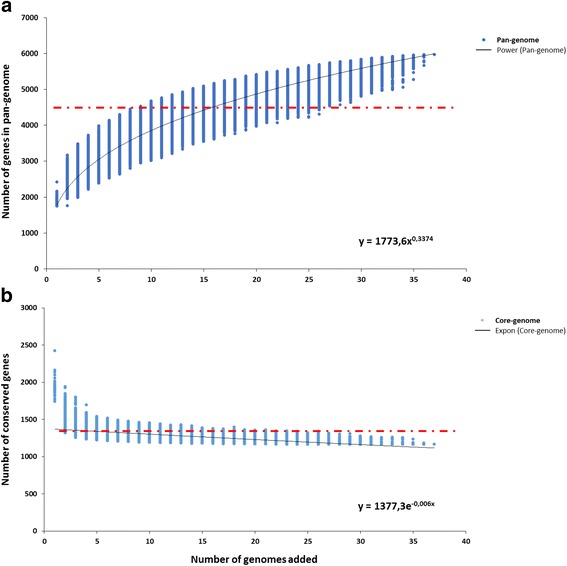
Pan-genome and core-genome of B. longum. a The pan-genome plot is represented by the accumulated number of new genes against the number of genomes added. b The core-genome plot is represented by the accumulated number of genes attributed to the core-genomes against the number of added genomes. The deduced mathematical function is reported. The red line represents the pan-genome and core-genome attributed to the 20 B. longum APC/DPC strains