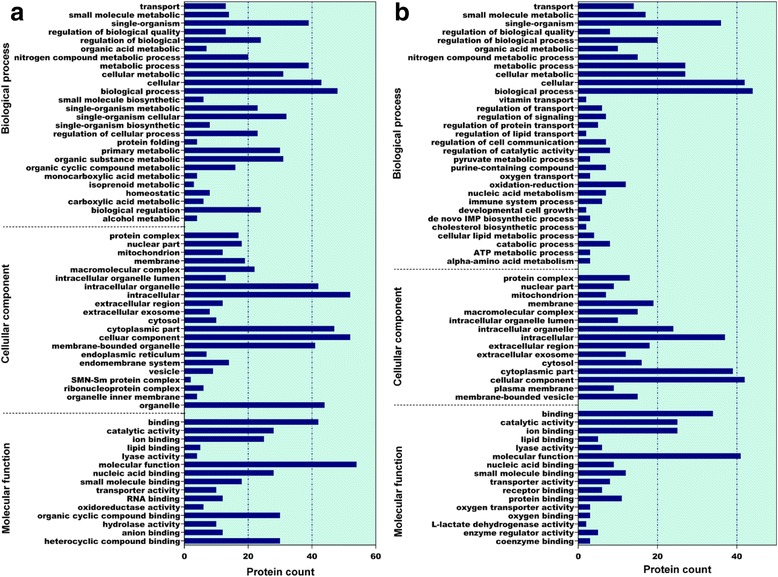
Fig. 4.

Bar chart of the gene ontology analysis. a: Differentially abundant proteins at E19 compared with E14; (b): Differentially abundant proteins at H1 compared with E19.The bar chart shows the distribution of corresponding GO terms. The length shows the number of all differentially abundant proteins associated with the GO term
