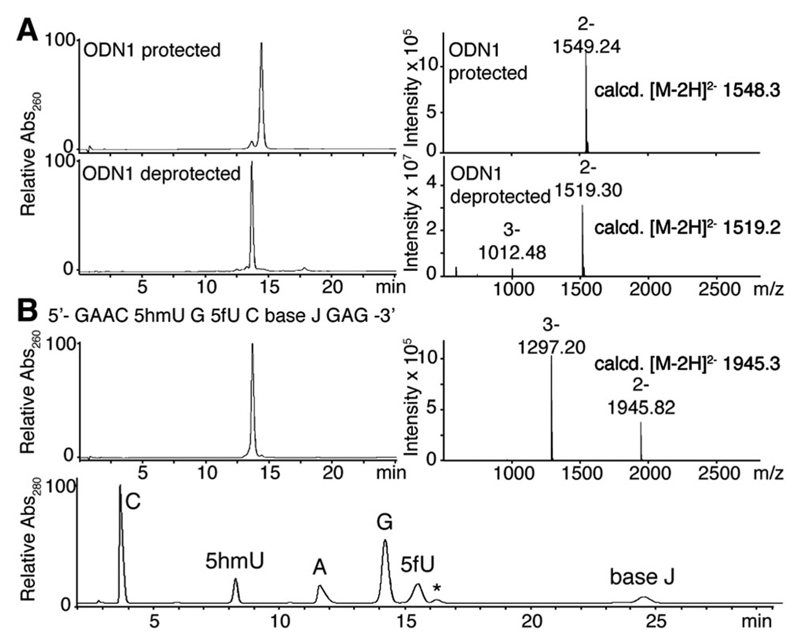
Fig. 1.
(A) LC trace of ODN1 before (top) and after (bottom) deprotection together with the corresponding ESI-MS (m/z) spectra of the largest peak. The small peak at 14.3 min in the top LC trace was characterized as the deprotected ODN1 by MS. (B) LC trace of the ODN with three different T modifications (top, left) with ESI-MS (m/z) spectra at the largest peak (top, right) and a LC trace of the ODN enzymatically digested into mononucleosides (bottom). The peak marked * is derived from the digestion buffer.

