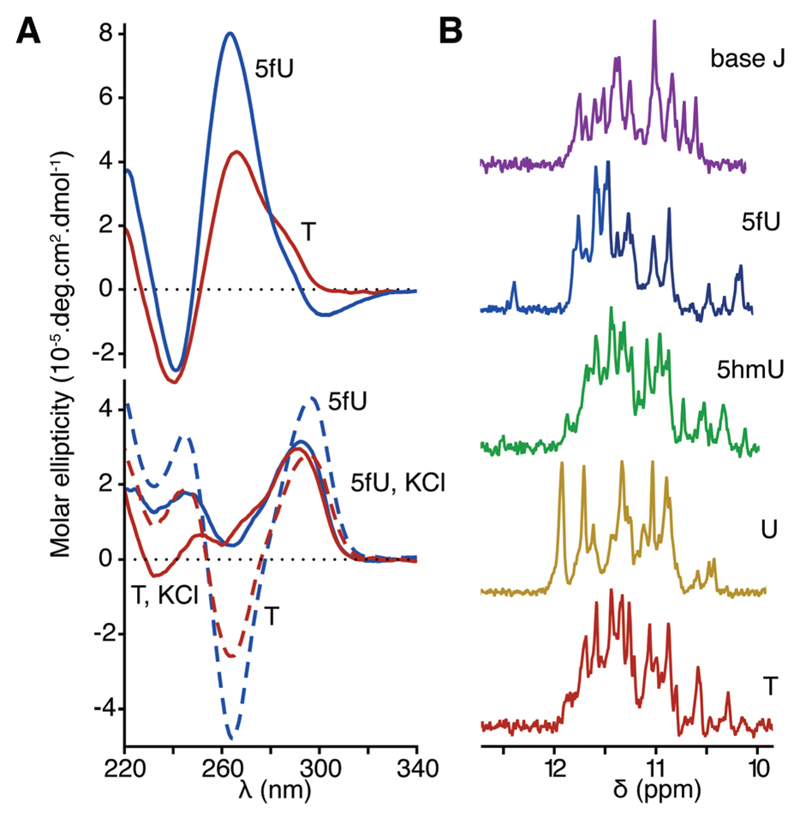
Fig. 3.
CD spectrum and NMR spectra of ODNs in the GGGTTA/TTACCC context. (A) ODN6–ODN7 duplex in PBS (top) and single stranded ODN6 in the presence (75 mM, solid line) or absence (dashed line) of KCl at pH 7.4 (bottom). Spectra of 5fU modified ODNs are in blue and T controls are in red. (B) 1H NMR spectra (500 MHz) of ODN6 in the presence of 100 mM KCl at pH 7.4.

